
The VIX is higher than it should be

Key points:
- The VIX "fear gauge" is well above where it should be compared to a synthetic VIX model of volatility
- It's also extremely high compared to a measure of stress in the bond market
- Similar behavior preceded consistent gains in stocks over the medium- to long-term
People seem too anxious
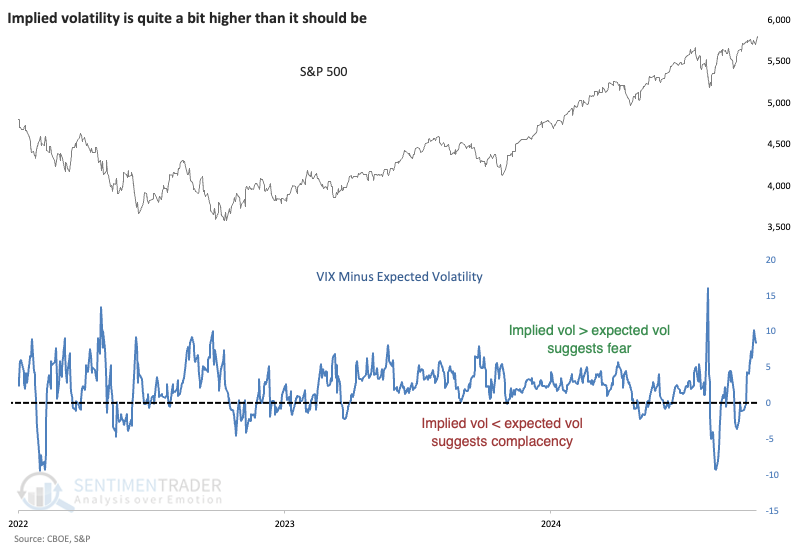
Investors are more nervous than they're supposed to be.
The VIX "fear gauge" has been elevated in recent sessions even though stocks haven't been all that volatile. Almost all traders are subject to recency bias, so implied future volatility (the VIX) is highly correlated to recent historical volatility.
Instead of using historical volatility-the amount of movement over, say, the past two weeks-I've previously referenced a synthetic VIX estimate. This calculation is based on six different academic models of where the VIX should be given the way the S&P 500 has behaved intraday and over time.
It includes models like Yang-Zhang's Drift-Independent Volatility Estimation Based on High, Low, Open, and Close Prices, which uses a minimum-variance unbiased variance estimator that is independent of the drift. Yeah, I don't understand the math, either. Regardless, it and the other models have a good record of tracking the VIX over time (+0.89 on a scale of -1.0 to +1.0 since 1986).
Until now.
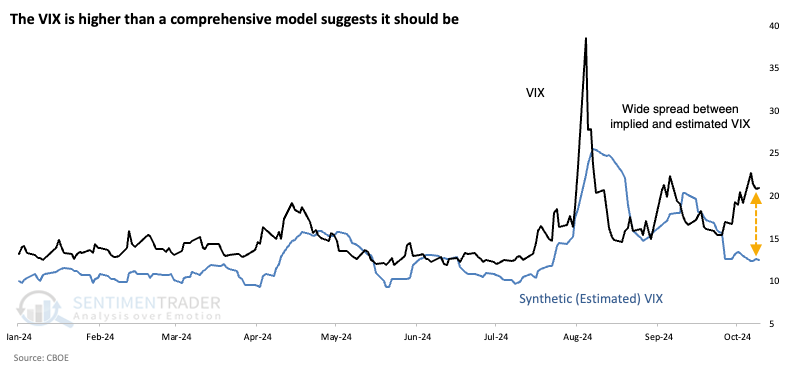
Late last week, the VIX was more than 10 points higher than the synthetic (estimated) VIX model, one of the widest spreads in years. We can assume that worries over the looming U.S. elections and geopolitics are the catalysts for this, but those are just guesses. Nobody knows though many will give their reasons.
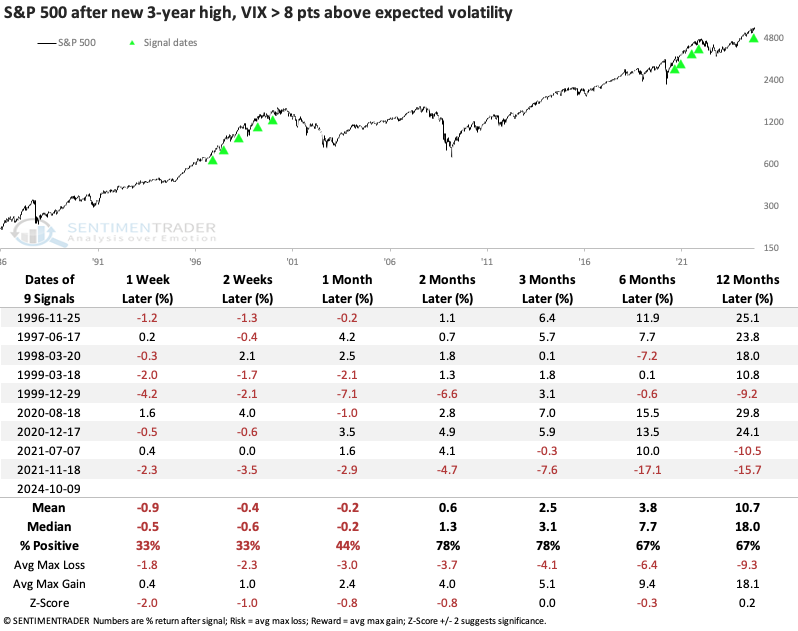
What matters most are any potential implications. And usually, the best way to determine possible implications is to examine what happened in the past when investors behaved similarly. The table below shows S&P 500 returns when it closed at a 3-year high, yet there were indications of fear, with the VIX more than 8 points above where it "should" be via the synthetic model.
Each time, the S&P showed no gain or a loss from a week to a month later, but only one morphed into a significant loss in the months ahead, near the peak of the 2021 mini-mania.
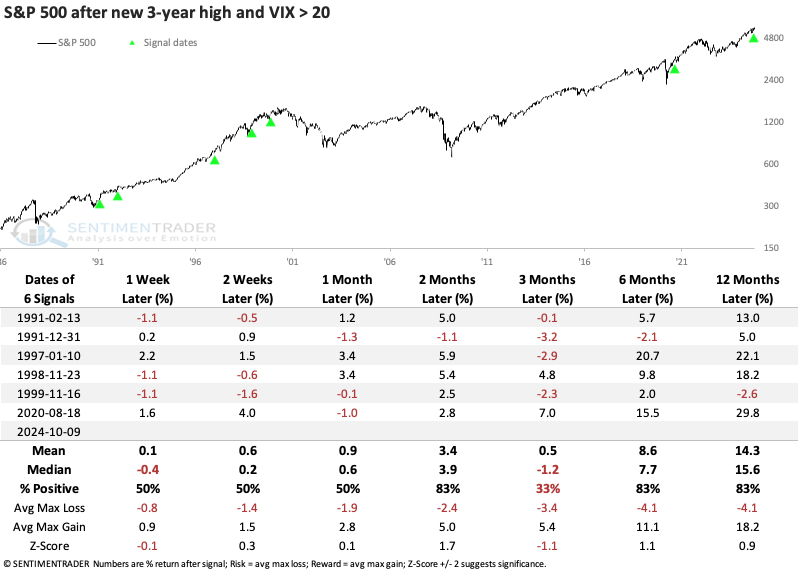
What's also unusual is that the VIX is relatively high, given where the S&P trades. It's highly unusual for the fear gauge to be above 20 when the S&P closes at a new high. Since 1986, it's only happened a handful of times, as shown below. While the next few months were mixed, there were no large losses within the following year, and mostly gains.
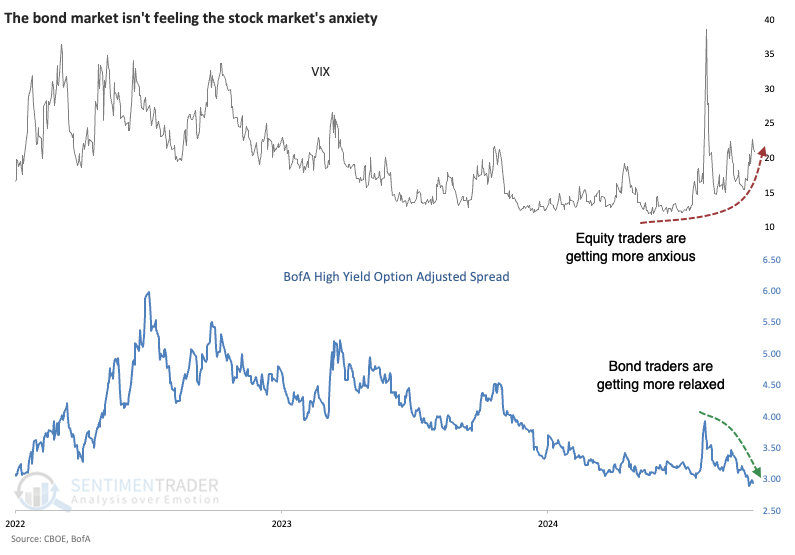
Calm in the bond market
While equity traders are becoming more anxious despite their most beloved index sitting at record highs, bond traders are becoming more sanguine. The spread on high-yield bond issues is coming down, not something typically seen before economic trouble.
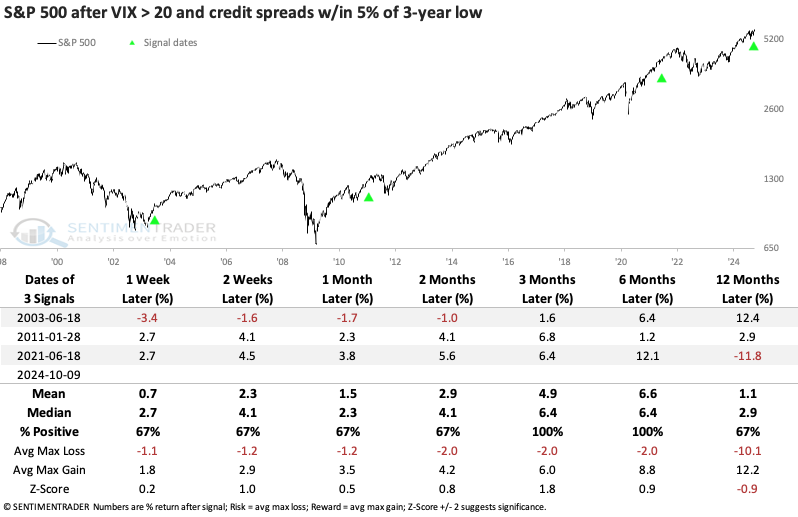
This is even rarer than the VIX being above 20 when the S&P is sitting at a new high. There have been only three times in 25 years when the VIX was this high, and spreads were in the bottom 5% of their range over the past few years. All preceded gains in the months ahead, though in 2021, it eventually led to the peak.
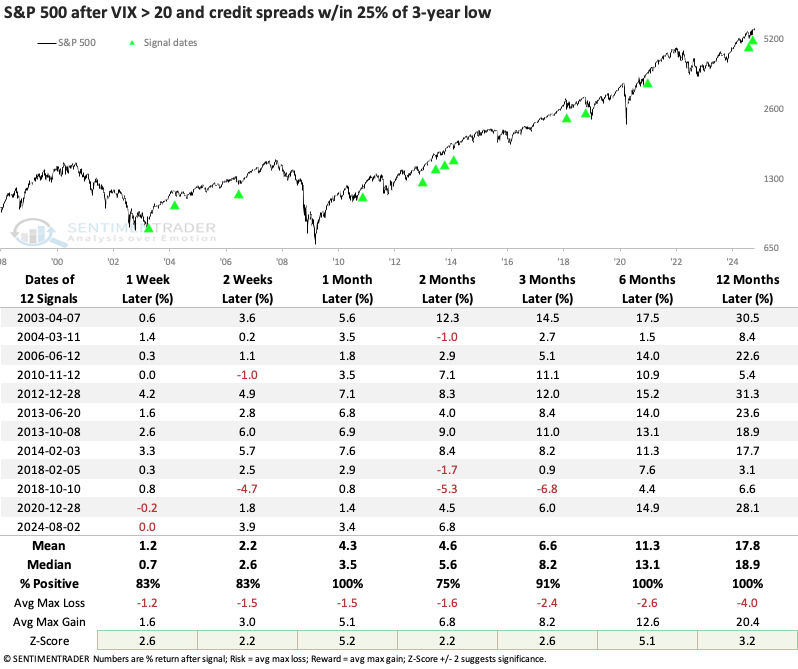
It's hard to glean much from a sample size of three, so the table below loosens the parameters to include times when the bond spread was in the bottom 25% of its range (instead of the bottom 5%). This greatly increases the sample size, and the conclusions are the same-it was a positive indication for the S&P 500.
Bond traders were much more adept at smelling trouble than equity options traders.
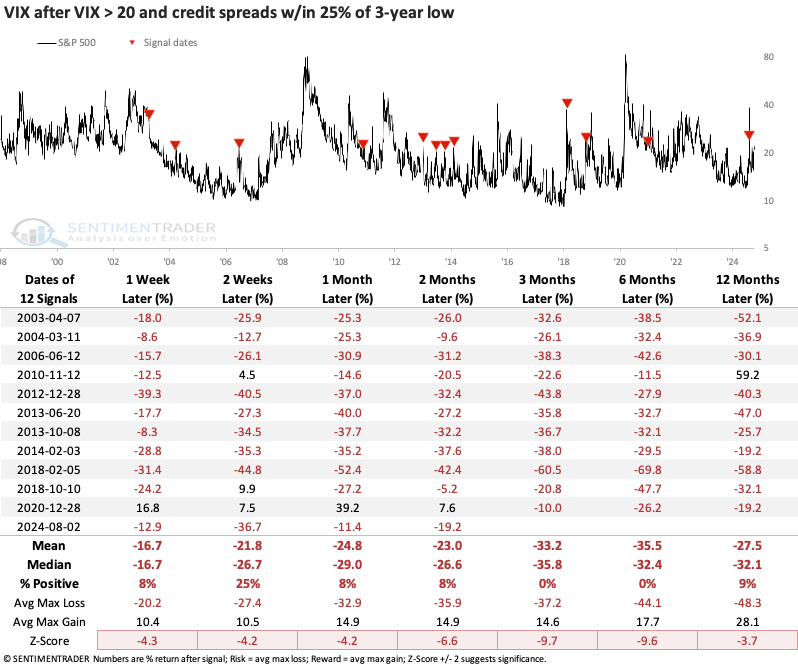
We can see below that these instances were not a precursor to a further rise in volatility. Ever. The VIX declined over the next 3-6 months every time.
What the research tells us...
There are all kinds of reasons to be wary of a levitating stock market ahead of what is sure to be a close election. In anticipation, traders have priced in a higher level of volatility than is justified by the recent past, which is their typical primary input. Surely, sometimes "unjustified" anxiety has proven to be beneficial, if not outright prescient. But those times are few and far between.
A much more typical outcome is that the reasons for the anxiety are already mostly known, considered, and priced in among the millions of participants. And the vast majority of the time - almost without exception - the aggregate conclusion that the situation is okay has panned out. It has been rare to see any meaningful, prolonged loss in stocks when implied fear has been so much higher than recent volatility and a lack of concern in credit spreads.