
The Ugly History of the British Pound in Q1

I am a fairly big proponent of considering seasonal trends in the financial markets. This stems from one particular trading concept that became firmly engrained in the grey matter a long time ago:
*A major key to success in the financial markets is finding an “edge” and exploiting it – preferably repeatedly
Enter seasonal trends, which are the very definition of patterns that (typically) repeat. If we were in a room together and I asked for a show of hands of anyone using technical analysis in their trading, most every hand would be in the air. If I asked for a show of hands of anyone that uses or has used fundamental analysis in their trading, once again, many hands would be raised. Now if I asked how many people ever used seasonal trends in their trading it would likely be me, a few other brave souls and maybe a couple of others giving furtive glances, trying to decide whether or not to raise their hand and be labeled as one of “those” people.
Which is fine by me. For consider the following rhetorical question: If you are looking for an edge in the markets, are you more likely to find it, a) where everyone else is looking? Or b) where only a small percentage of people are looking? I will leave you to ponder your own answer to that question.
Of course, the “catch” with any seasonal trend is that there is never any guarantee at all that it will work “this time around.” Which is why ideally seasonal trends are used in conjunction with “something else” to help confirm or deny the existence of an opportunity. Take the British Pound for example.
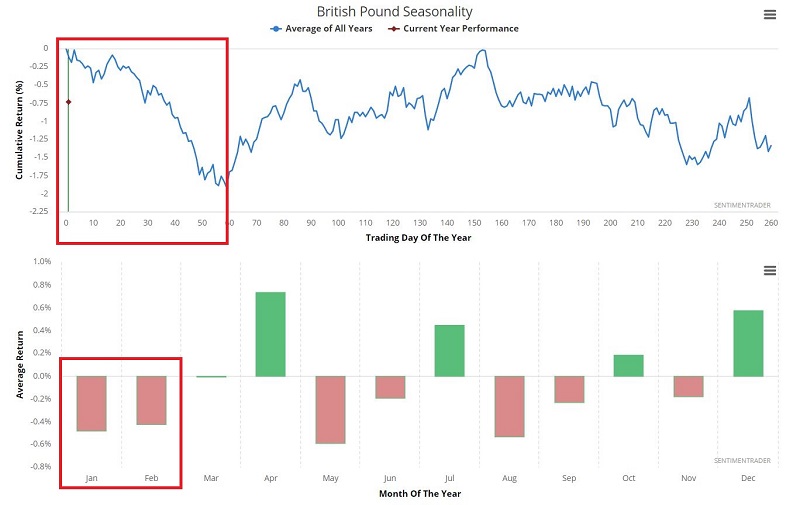
The chart below displays the annual Seasonal trend for the British Pound. Until about the last week of March things are pretty dreadful. Of course, this DOES NOT mean that every year will play out in exactly this manner. But the long-term trend is fairly unmistakable.
British Pound annual seasonal trend
Optimism is presently near the high end of the range for the Pound. This level of optimism has often preceded declines in the price of the Pound.
British Pound Optix at an extremely high level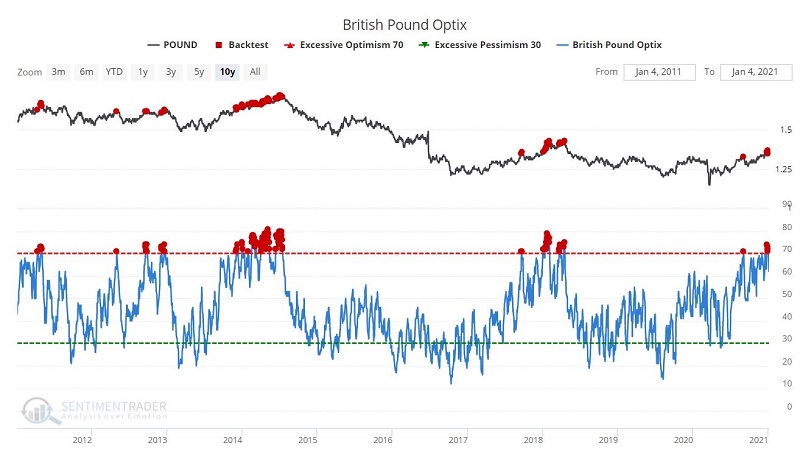
Following all readings above 70 for the British Pound Optix, results for the following 1-, 2- and 3-month period has been decidedly mixed at best, with the Pound averaging a loss in price and less than a 50%-win rate.
Price action following BP Optix > 70%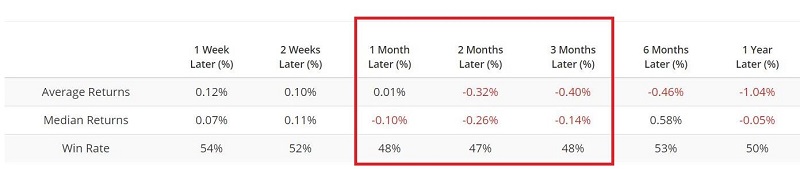
Now let’s focus on Q1 performance. Using the spot contract to measure results, the Pound has gained ground during January 1 through March 31st 19 out of the past 46 years, or 41% of the time. Even more concerning is that the average gain was +$2,400 and the average loss was -$4,400 – a profit loss ratio of just 0.55.
British Pound Q1 $ + (-)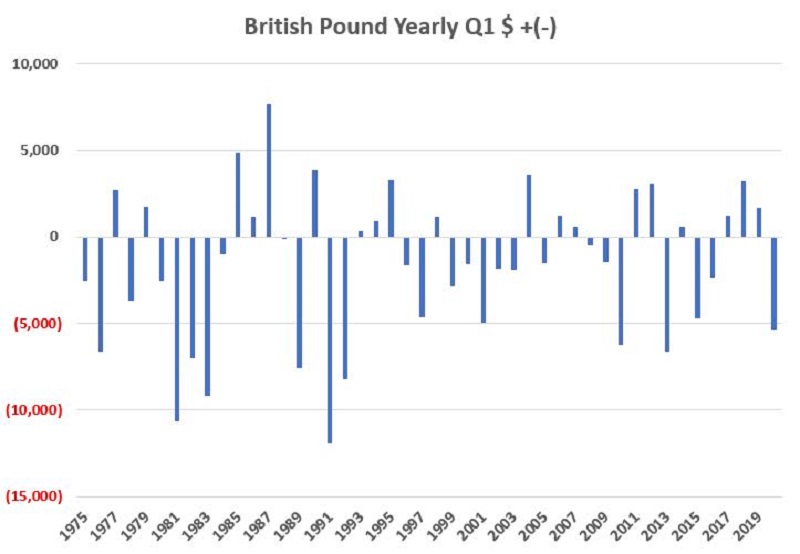
When considered on a cumulative basis the results for the Pound in Q1 are fairly compelling and the long-term trend is fairly unmistakable.
British Pound Cumulative Q1 $ + (-)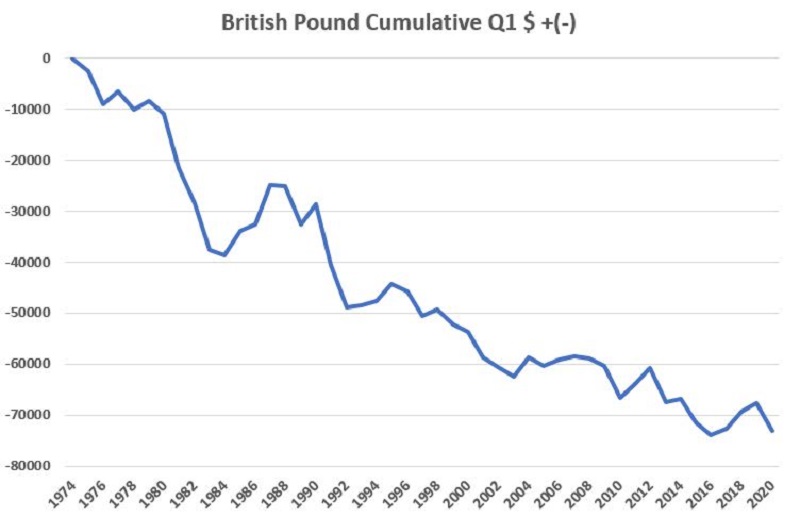
In terms of recent price action, the Pound moved sideways for over three years after hitting a low in late 2016. It plunged temporarily (like a lot of other things) in March 2020 and has been rallying strongly in recent months. And the rally may in fact continue.
But history, sentiment and the calendar all suggest caution in chasing this particular rally.