Products
SentimenTrader Trading Tools
‍
Backtest Engine
My Trading Toolkit
Correlation Analysis
Seasonality
Indicators & Data API
‍
Proprietary Indicators & Charts
Market Data API
Strategies & Scanner
‍
50+ Trading Strategies
Smart Stock Scanner
Research Reports
‍
Research Solutions
Reports Library
Free Resources
Simple Backtest Calculator
Simple Seasonality Calculator
The Kelly Criterion Calculator
Sentiment Geo Map
Public Research Reports
Pricing
Company
About
In the News
Testimonials
Client Success Stories
Contact
Log inLoginSign up
< BACK TO ALL REPORTS

The tech sector's relative breakout cluster

Jason Goepfert
2023-05-22
A handful of Technology stocks have powered most of the gains in the S&P 500 in 2023, and an index of those stocks has enjoyed a cluster of new highs relative to the S&P in recent weeks. Similar breakouts had a modest tendency to precede more gains for Tech and the S&P, and usually saw Tech continue to outperform.

Key points:

  • An index of Technology sector stocks has set a cluster of new highs relative to the S&P 500
  • This follows what had been new multi-year lows for the ratio earlier this year
  • Similar behavior tended to precede modestly positive returns, especially for Tech versus the S&P

Tech powers the market higher and sets a new relative high

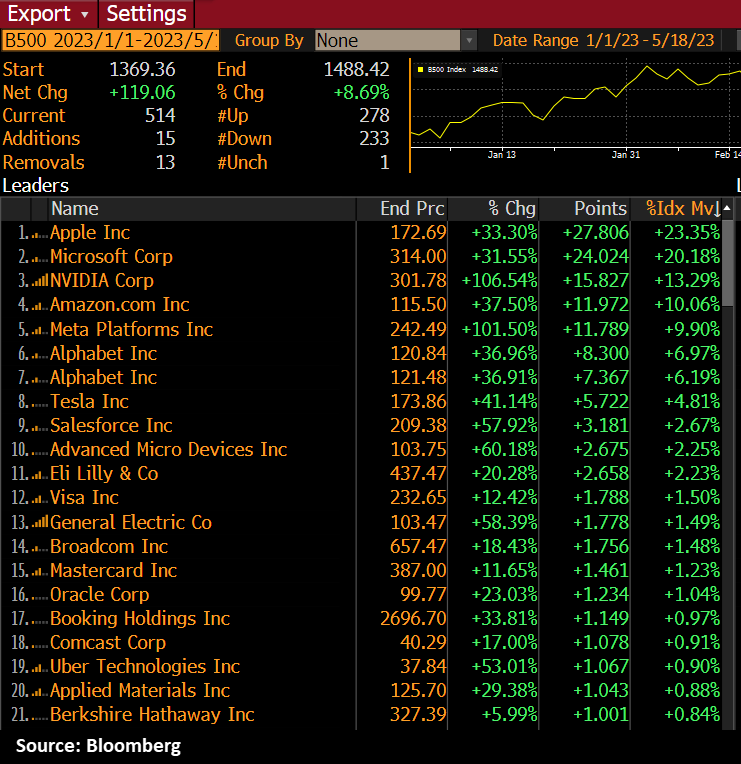
Tech stocks have had an outstanding year, especially the big ones. According to Bloomberg calculations, a handful have accounted for all the gains this year in an index mimicking the S&P 500.

The table below shows, in descending order, how many points and percentages of the index's move were accounted for by the top stocks. If Amazon is included as a "tech" stock, they more than make up the index's total gain for the year. As Dean recently noted, Semi stocks are among those leaders and are breaking out.

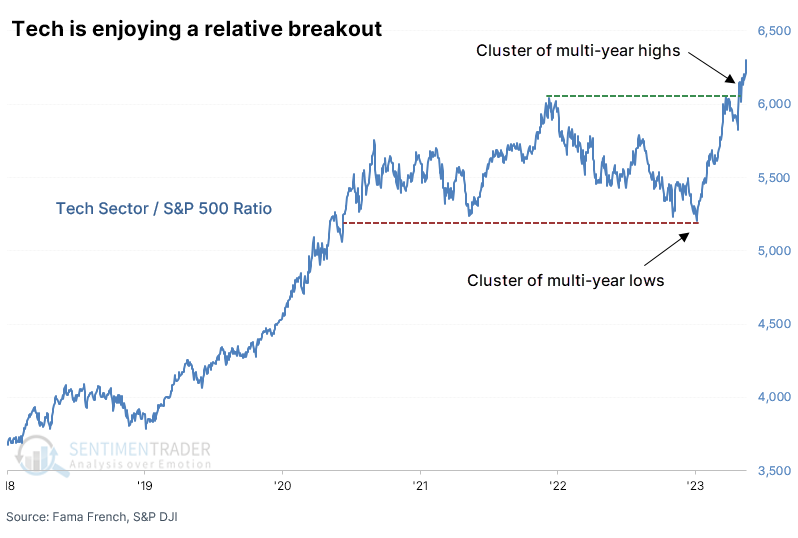
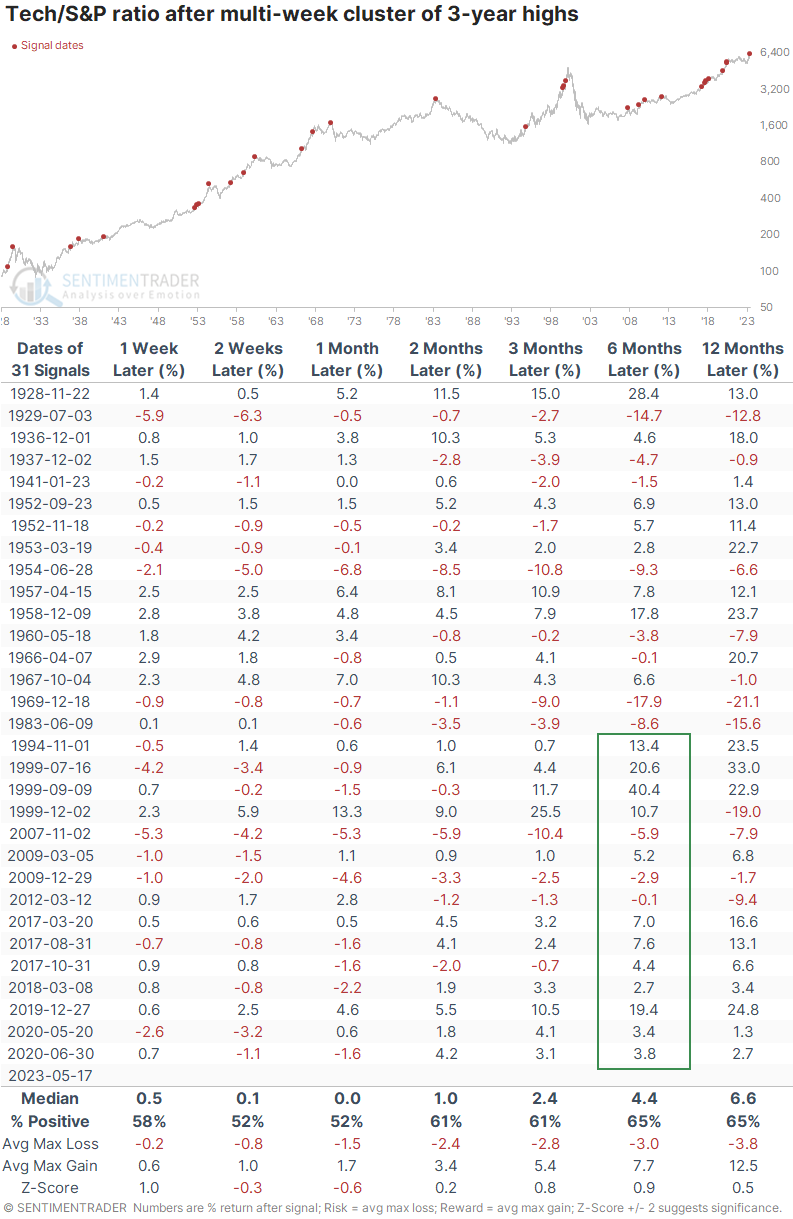
As a result, a proxy index of the Technology sector has not only broken out to a new high relative to the S&P 500, it has continued to shoot higher. It was only earlier this year when the ratio dragged along at a multi-year low.

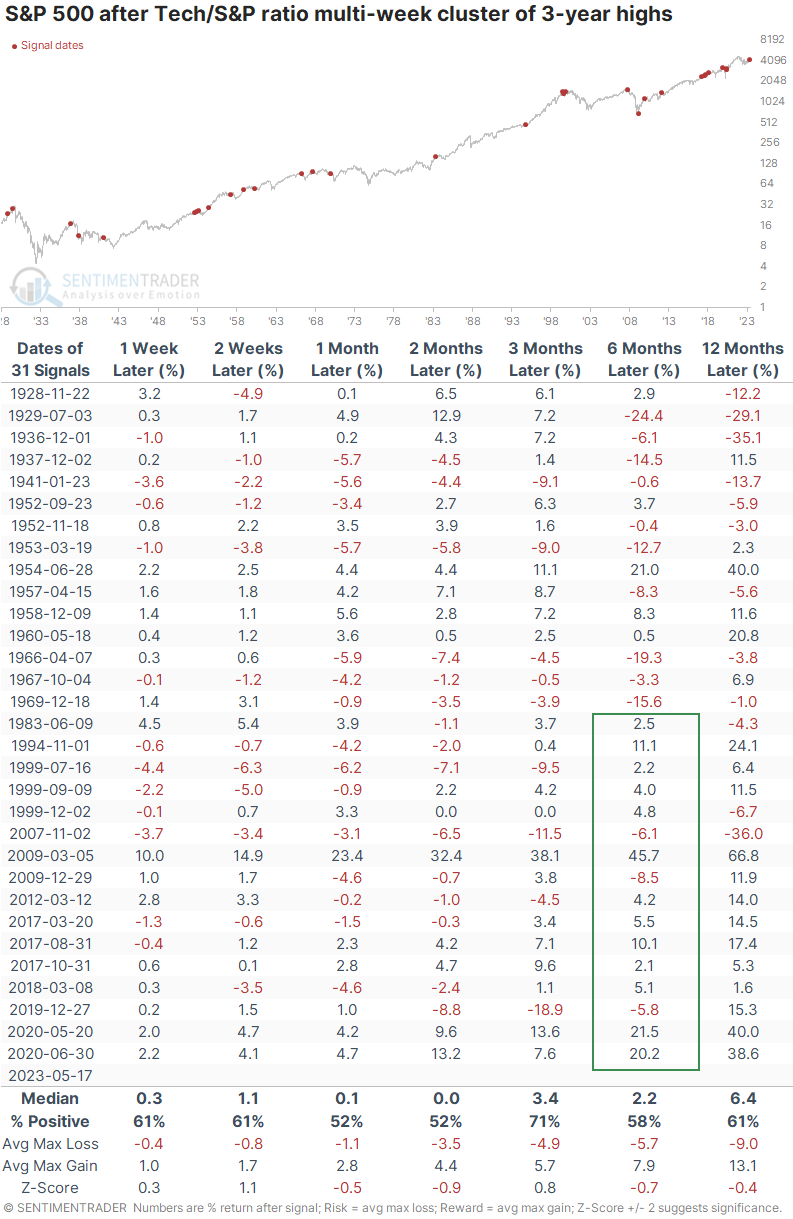
Out of the past 15 sessions, over half of the days have witnessed a new high in the Tech to S&P 500 ratio. The table below shows returns for the S&P after these clustered signals. It proved to be a mediocre sign for the index in general, with returns about in line with random and unimpressive consistency. Over the past 40 years, six-month returns have been much better than prior decades.

It was perhaps a modestly better sign for the Tech sector, but still not a solid edge. Over the past 30 years, the six-month returns were among the best, with 13 out of 15 signals sporting a positive return and only 2007 being a significant loser, though the 1999 signal morphed into one.

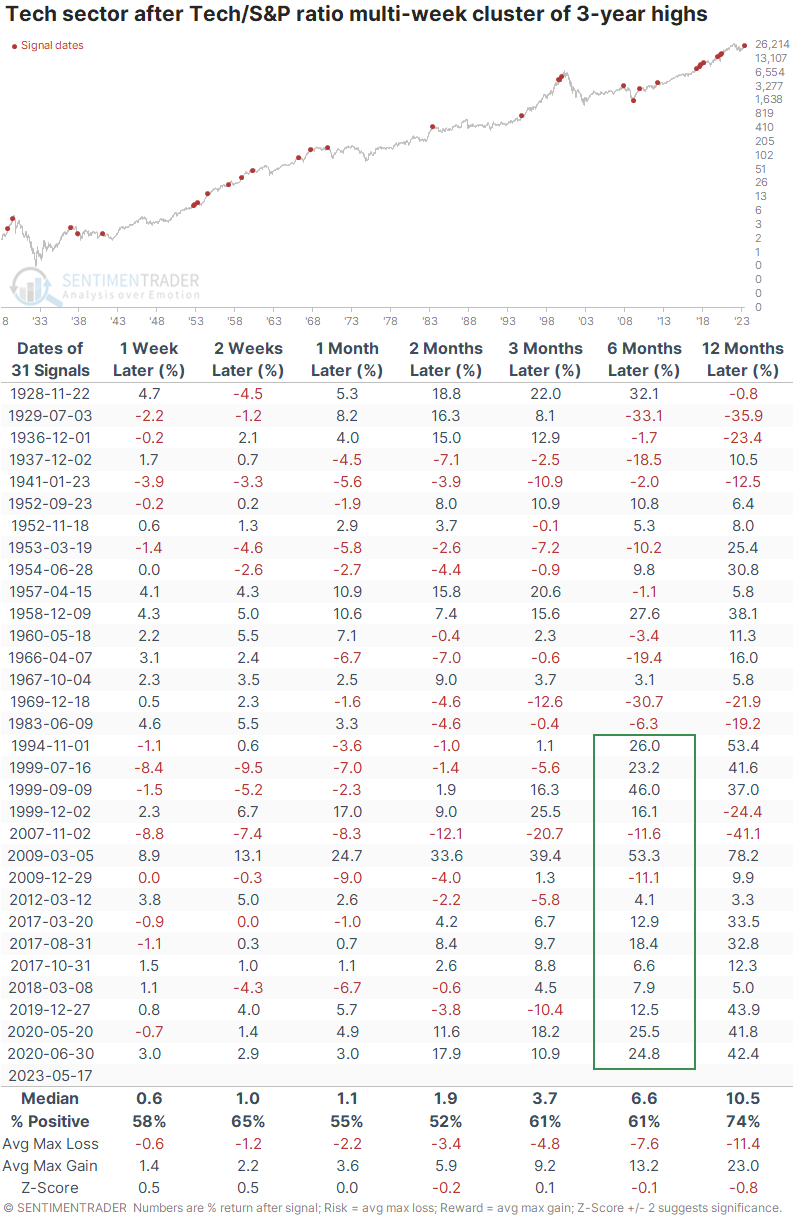
Tech's relative outperformance may continue

When looking at the relative performance of Tech versus the broader S&P index, the six-month window showed the most consistent outperformance, especially over the past three decades. There were only three times when Tech did not outperform, and the differences were relatively minor.

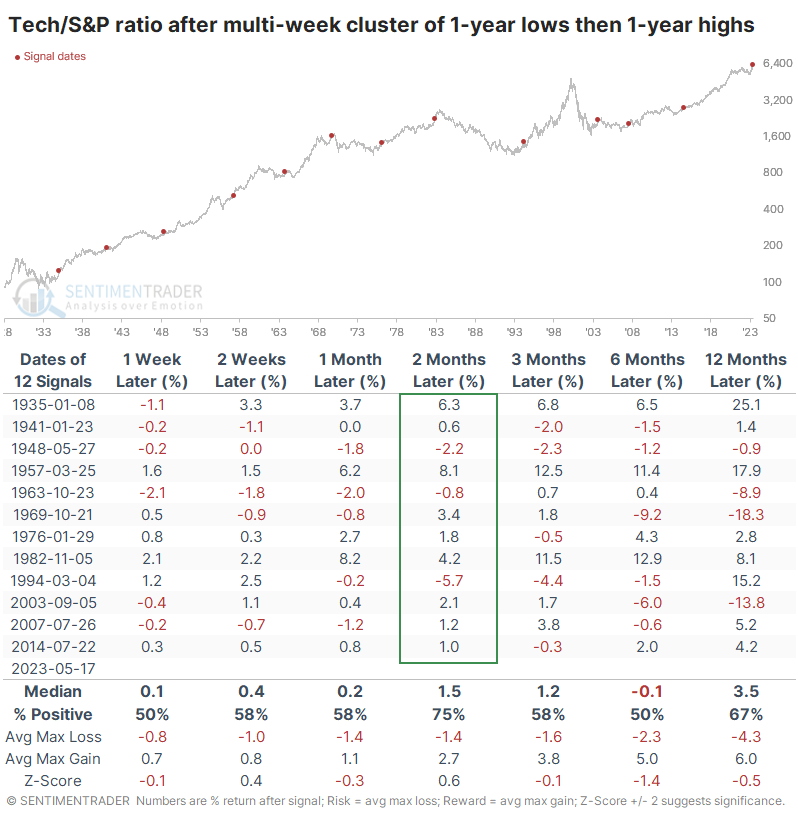
This is the 13th time when there was a cluster of days when the ratio made at least 1-year lows, which then cycled to a cluster of 1-year highs. Once again, this wasn't a very clear signal, but perhaps it slightly favors those bullish on Tech.

When looking at the ratio between Tech and the S&P, these cycles preceded further outperformance most of the time, especially over the next two months. Over the next year, Tech outperformed after 8 of the 12 times, and one of the losers was small.

What the research tells us...

After a bubbly year like 2021, investors naturally look for evidence that it's still in effect. We're nowhere near the absurdities witnessed then; in fact, most indicators suggest we're closer to the opposite extreme than anything. With a handful of Tech stocks driving the overall market higher, there is a chorus of eye-rolling "here we go again" statements. There is some truth to the idea that underlying breadth is only so-so, but there is also not much evidence that it's a reliable sell signal. For Tech stocks themselves, their recent outperformance may be a decent sign that they'll likely keep outperforming, at least over the medium term.

Sorry, you don't have access to this report

Upgrade your subscription plan to get access
Go to Dasboard
PRODUCTS
SentimenTrader
Trading Tools
Indicators & Data API
‍
Strategies & Scanner
‍
Research Reports
FREE
RESOUrCES
Simple Backtest
Calculator
Simple Seasonality
Calculator
The Kelly Criterion
Calculator
Sentiment Geo Map
‍
Public Research Reports
‍
Pricing
Bundle pricing
‍
Announcements
‍
FAQ
COMPANY
‍
About
‍
In the News
‍
Testimonials
‍
Client Success Stories
CONTACT
‍
General Inquiries
‍
Media Inquiries
‍
Financial Professionals Inquiries
‍
© 2025 Sundial Capital Research Inc. All rights reserved.
Setsail Marketing
TermsPrivacyAffiliate Program
Risk Disclosure: Futures and forex trading contains substantial risk and is not for every investor. An investor could potentially lose all or more than the initial investment. Risk capital is money that can be lost without jeopardizing ones’ financial security or life style. Only risk capital should be used for trading and only those with sufficient risk capital should consider trading. Past performance is not necessarily indicative of future results.

Hypothetical Performance Disclosure: Hypothetical performance results have many inherent limitations, some of which are described below. No representation is being made that any account will or is likely to achieve profits or losses similar to those shown; in fact, there are frequently sharp differences between hypothetical performance results and the actual results subsequently achieved by any particular trading program. One of the limitations of hypothetical performance results is that they are generally prepared with the benefit of hindsight. In addition, hypothetical trading does not involve financial risk, and no hypothetical trading record can completely account for the impact of financial risk of actual trading. for example, the ability to withstand losses or to adhere to a particular trading program in spite of trading losses are material points which can also adversely affect actual trading results. There are numerous other factors related to the markets in general or to the implementation of any specific trading program which cannot be fully accounted for in the preparation of hypothetical performance results and all which can adversely affect trading results.

Testimonial Disclosure: Testimonials appearing on this website may not be representative of other clients or customers and is not a guarantee of future performance or success.