The tech and growth story (part 2)
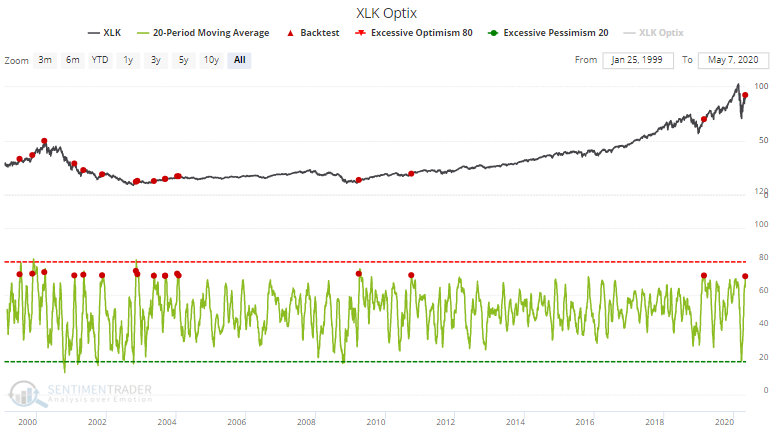
Tech stocks continue to significantly outperform stocks in other sectors. Our XLK Optix's 20 day average is currently at 71:
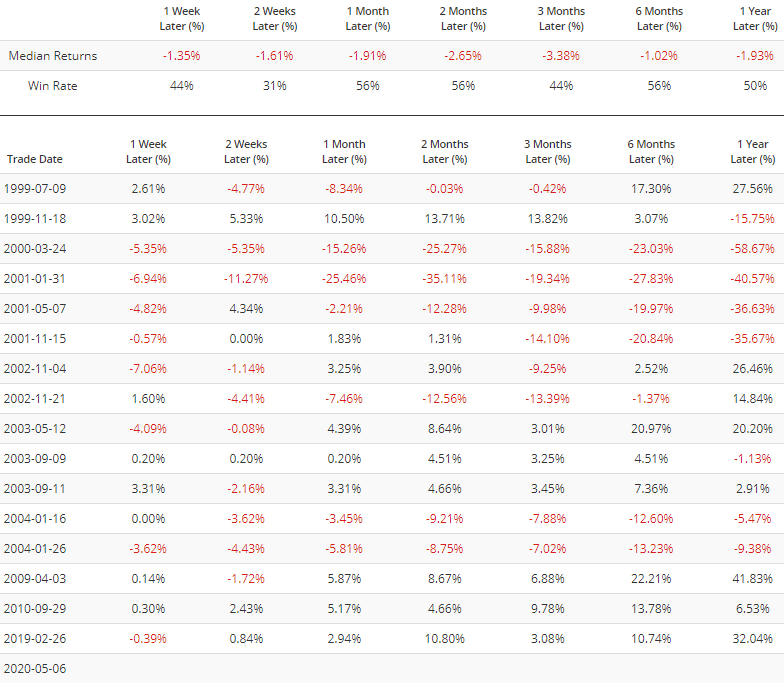
In the past, this often led to a short term pullback over the next few weeks and months:
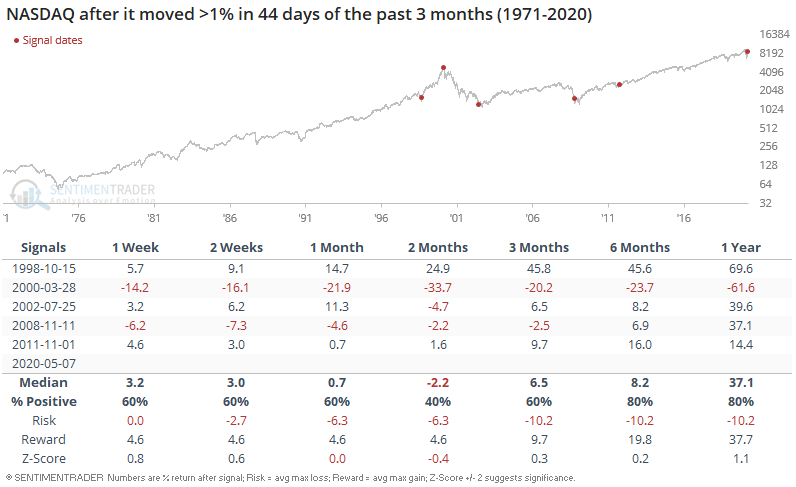
From a longer term perspective, the NASDAQ 100 continues to see a decent amount of volatility. 44 days in the past 3 months have seen the NASDAQ 100 move up or down more than 1%:
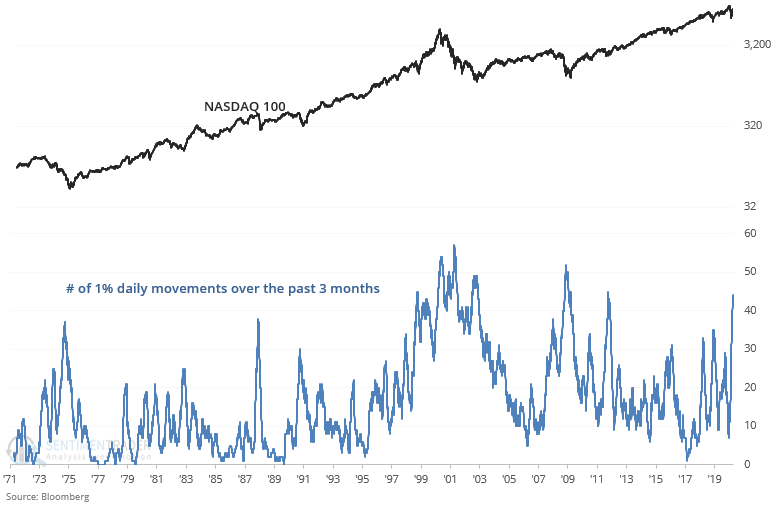
Such extreme bouts of volatility usually led to more gains over the next year. The one big exception came in March 2000, when many of the 1% daily movements were UP during the NASDAQ's parabolic rally in late-1999 and early-2000. So clearly whether the previous 1% daily movements were mostly UP or DOWN mattered. Right now, it has been a bit of both:
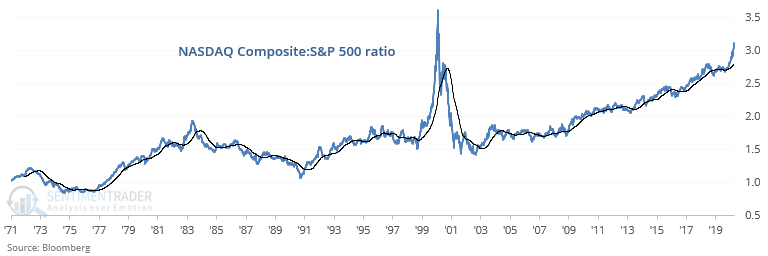
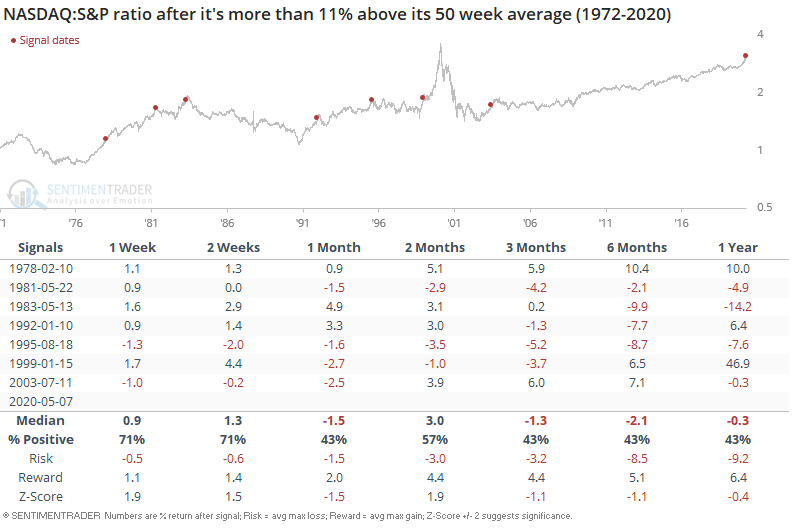
The NASDAQ:S&P ratio continues to surge and is now more than 11% above its 50 week average:
This usually led to a pullback in the NASDAQ:S&P ratio over the next 3-6 months as investors and traders became less optimistic about growth and tech stocks:
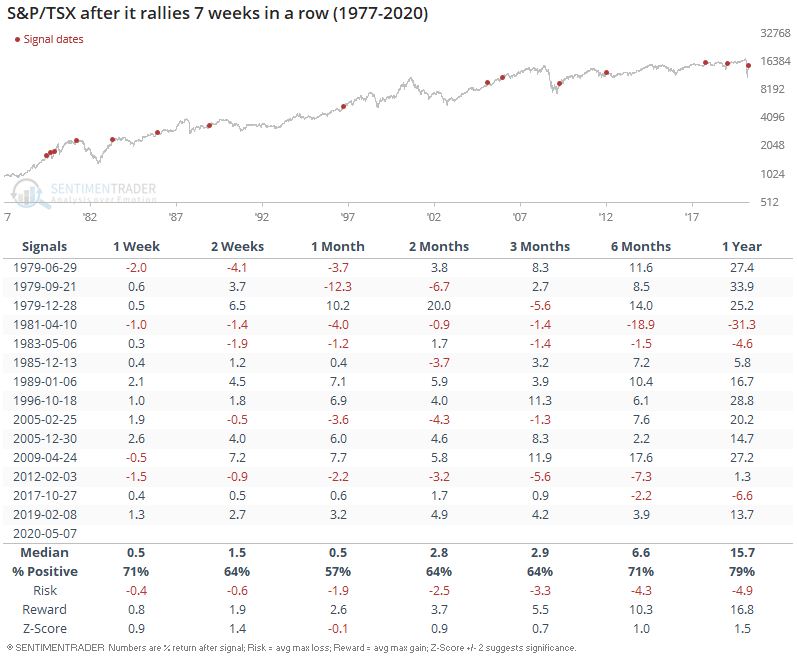
Overseas, Canadian stocks are among those rallying the most consistently. The S&P/TSX is up 7 weeks in a row (assuming that stocks don't fall significantly on Friday):
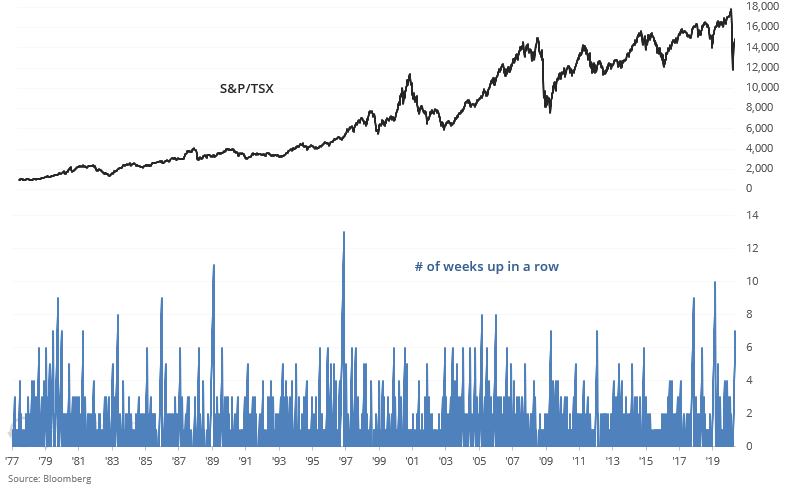
This wasn't a clear short term bearish sign in the past, although it did usually lead to more gains for Canadian stocks over the next year: