
The surprising reach of bond volatility

Key points
- The Bond Market VIX (MOVE) is designed to track trader sentiment regarding bond volatility
- MOVE recently spiked to an extreme reading
- This piece takes an in-depth look at how a variety of markets have reacted in the past - and highlights a potential price-based clue
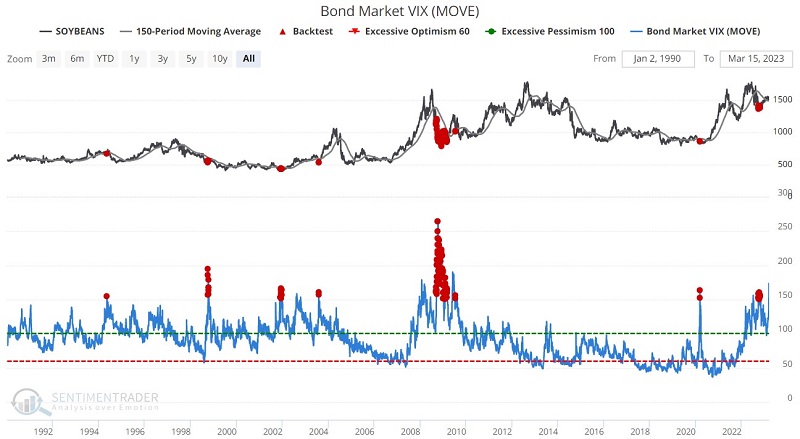
The Bond Market VIX (MOVE)
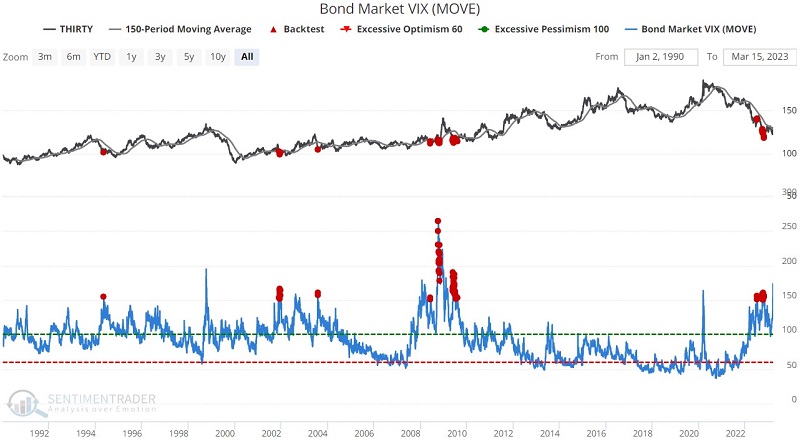
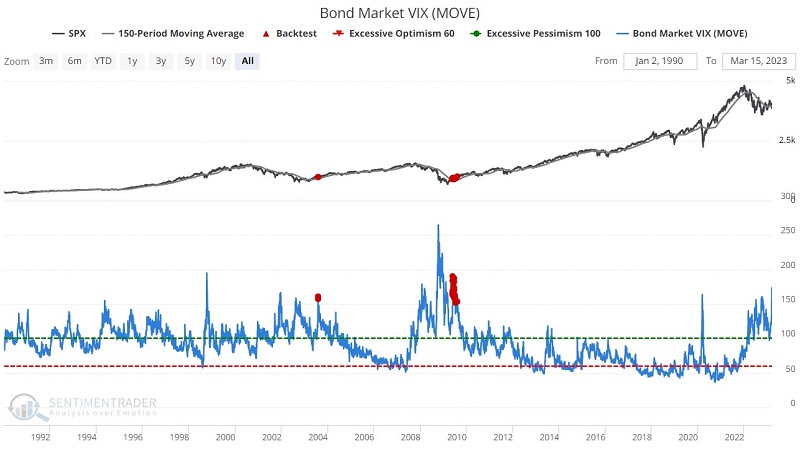
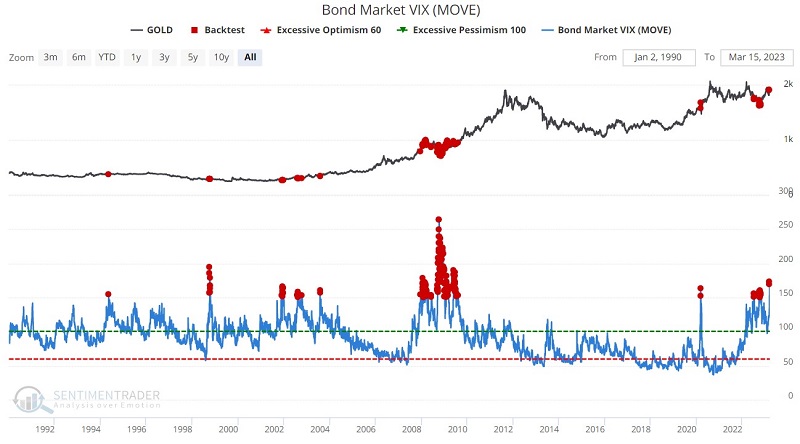
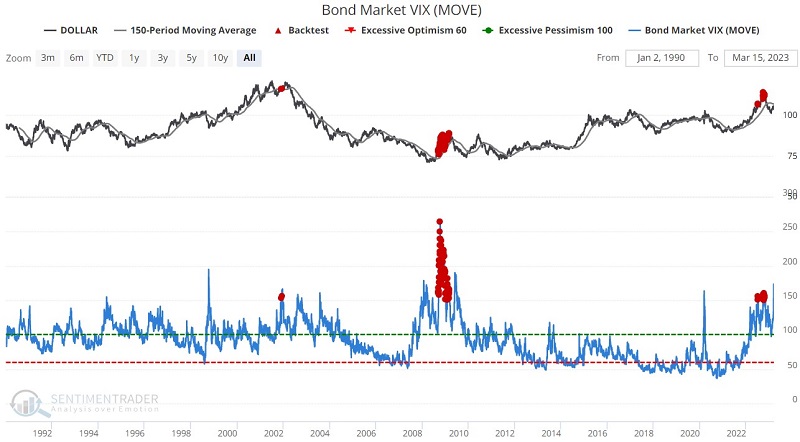
Merrill Lynch developed the MOVE index (MOVE) to measure the implied volatility of US Treasury markets. It is a yield-curve weighted average of normalized implied volatility of 30-day options. It is similar to the VIX for stocks that most people are familiar with in that during periods of high uncertainty, options traders will price in wider moves, and the MOVE index will rise, suggesting some fear in the bond market. During relative quiet and expected calm conditions, the MOVE will fall. The chart below shows 30-year treasuries in the top clip and MOVE in the bottom clip.
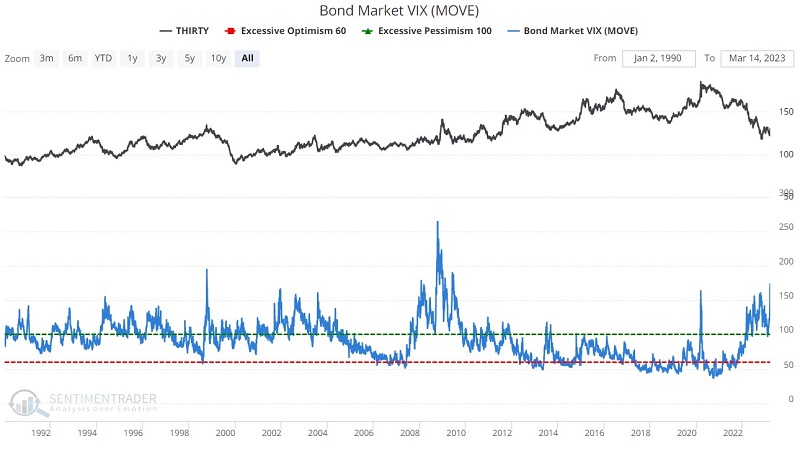
For testing purposes, we will deem any MOVE reading above 150 as "extreme." Because t-bonds move based on iterest rates, and because interest rates represent the "cost" of money, what happens in the bond market has a ripple effect across many other markets.
The problems with MOVE
For one thing, MOVE is not a highly reliable contrary indicator for bonds to the extent that the VIX Index is for stocks. As we will see in a moment, spikes and/or high readings do not necessarily equate to oversold buying opportunities for bonds. Likewise, extremely low MOVE readings do not necessarily equate to overbought situations for bond prices.
One other problem is that results appear to be somewhat skewed by the prolonged period of extreme readings that occurred in 2008-2009.
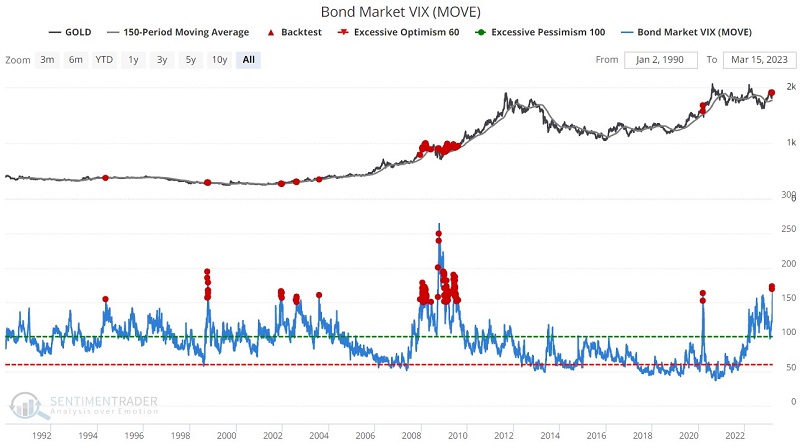
Another quirk revealed itself when we moved beyond just testing bonds and tested other securities such as the S&P 500, gold, the US dollar, and even soybeans. In most cases, it appears to make a difference whether the security in question was above or below its 150-day moving average at the time that bond volatility was high.
For each security, we will look at how it performed following all extreme MOVE readings. We will then break the results down into two categories:
- MOVE > 150 while price > 150-day moving average
- MOVE > 150 while price < 150-day moving average
As you will see, the most surprising thing is the difference in results based on the trend of the moving average filter.
Thirty-year bonds
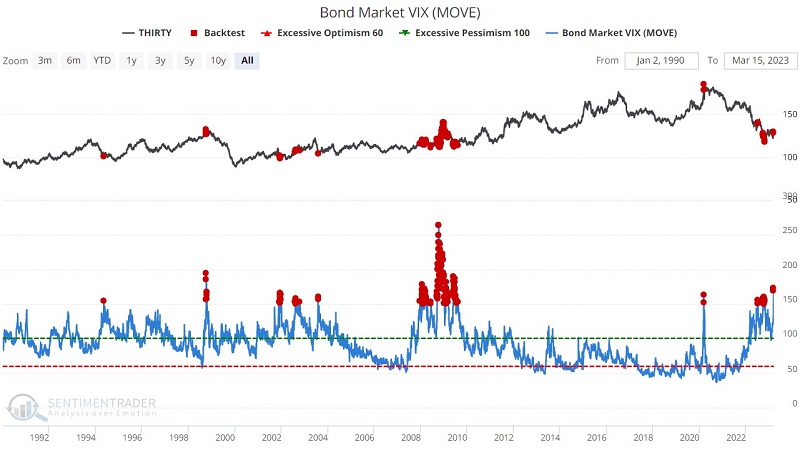
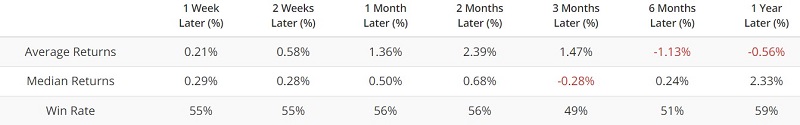
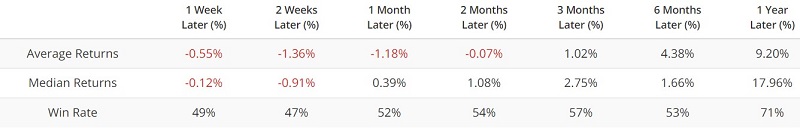
The chart and table below display thirty-year treasury bond performance anytime MOVE is greater than 150. The forward performance for t-bonds following extreme readings were essentially a coin-flip.
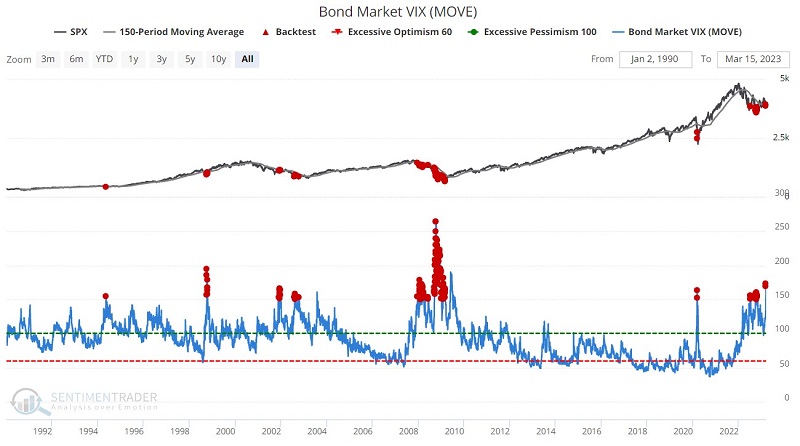
The chart and table below display thirty-year treasury bond performance anytime MOVE is greater than 150 and price is above its 150-day moving average.
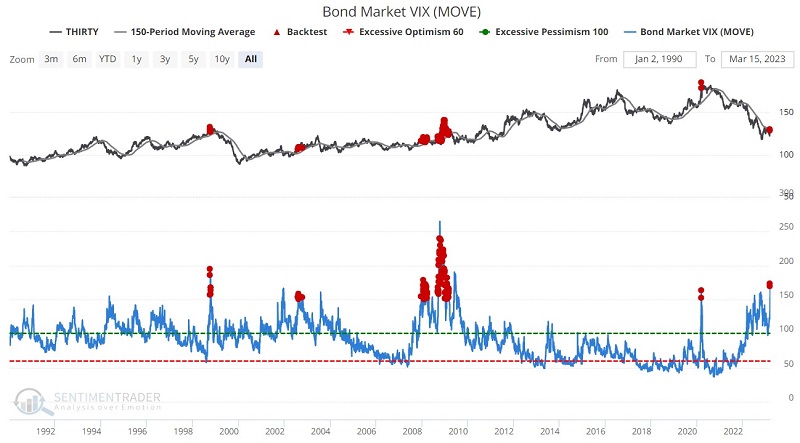
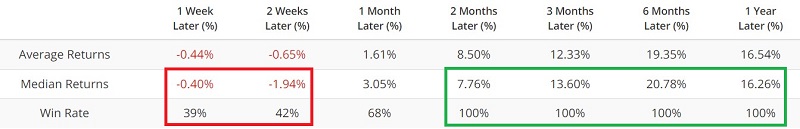
The chart and table below display thirty-year treasury bond performance anytime MOVE is greater than 150 and price is below its 150-day moving average.
Historically, t-bonds have performed better when price is below the 150-moving average at the time of a MOVE 150+ reading.
S&P 500 Index
The chart and table below display S&P 500 performance anytime MOVE is greater than 150. As with t-bonds, overall the results are roughly a coin-flip.
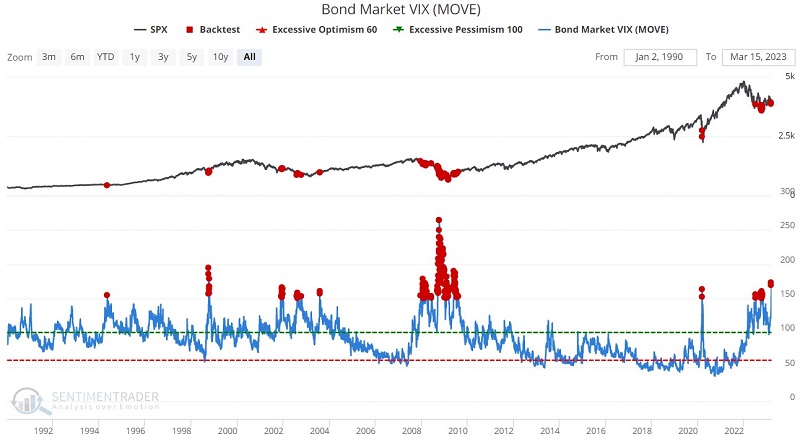
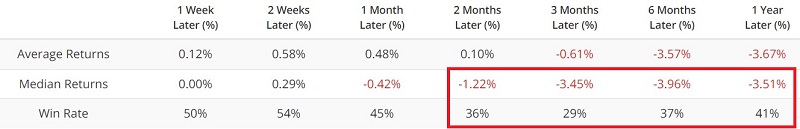
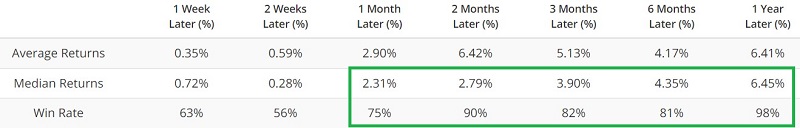
The chart and table below display S&P 500 performance anytime MOVE is greater than 150 and price is above its 150-day moving average.
The chart and table below display S&P 500 performance anytime MOVE is greater than 150 and price is below its 150-day moving average.
Unlike t-bonds, the S&P 500 has performed much better better when price is above the 150-moving average at the time of a MOVE 150+ reading.
Gold
The chart and table below display Gold performance anytime MOVE is greater than 150.
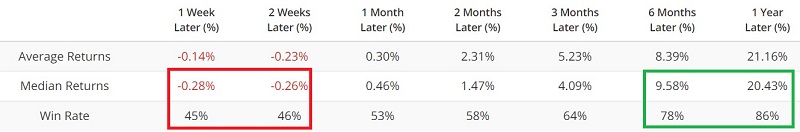
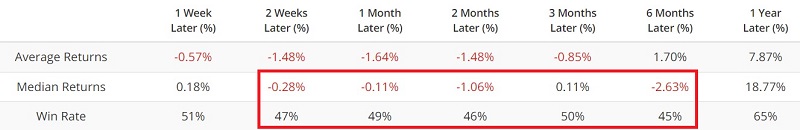
The chart and table below display Gold performance anytime MOVE is greater than 150 and price is above its 150-day moving average.
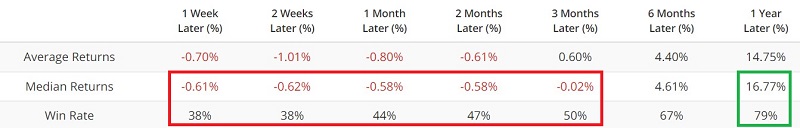
The chart and table below display Gold performance anytime MOVE is greater than 150 and price is below its 150-day moving average.
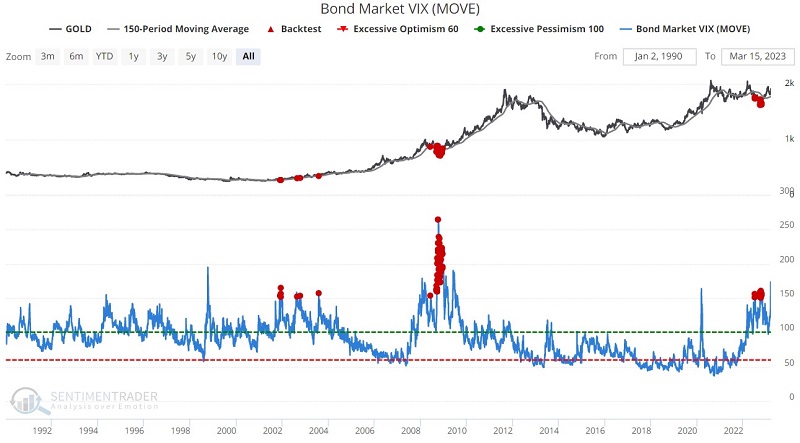
Much like t-bonds, Gold has performed better when price is below the 150-moving average at the time of a MOVE 150+ reading.
US Dollar
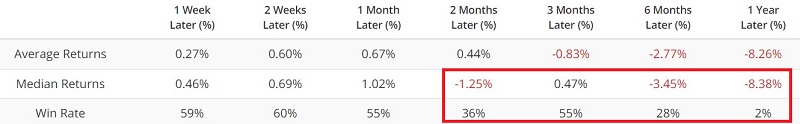
The chart and table below display US Dollar performance anytime MOVE is greater than 150. Overall, the dollar tends toward weakness following a MOVE reading above 150.
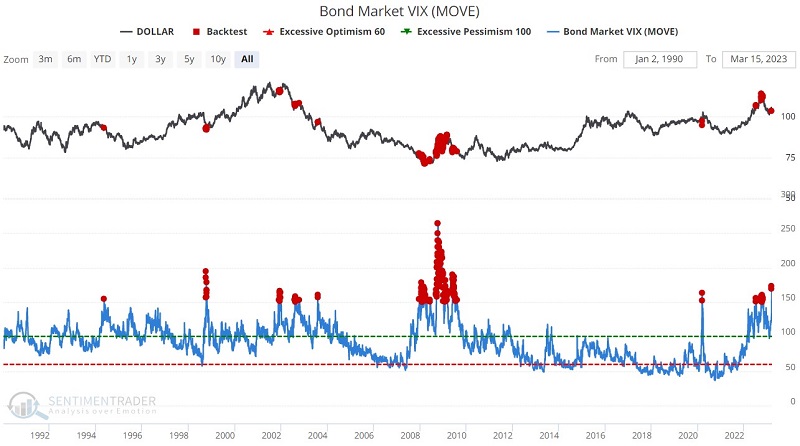
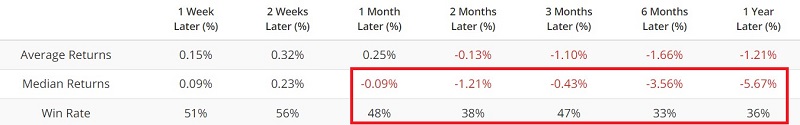
The chart and table below display US Dollar performance anytime MOVE is greater than 150 and price is above its 150-day moving average. Note the extreme weakness six and twelve months later.
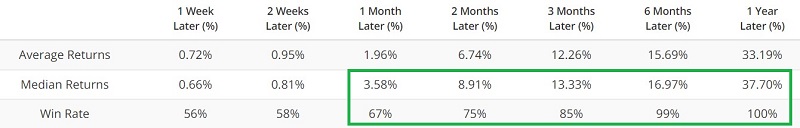
The chart and table below display US Dollar performance anytime MOVE is greater than 150 and price is below its 150-day moving average. Again we see a tendency towards weakness, with the exception of the six months to twelve months period.
The US Dollar has tended to show weakness during the first six months after a MOVE 150+ reading, regardless of whether price was above or below the 150-day moving average at the time of the signal. The one major difference has been 1-year after a signal:
- When price was above the 150-day average, the dollar lost ground over the next twelve months 98% of the time, with a median loss of -8.38%
- When price was below the 150-day average, the dollar gained ground 79% of the time, with a median gain of +8.52%
Soybeans
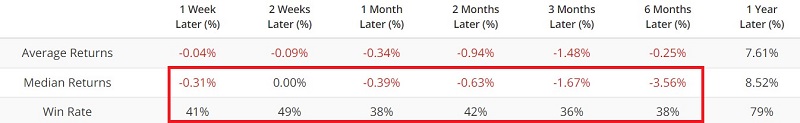
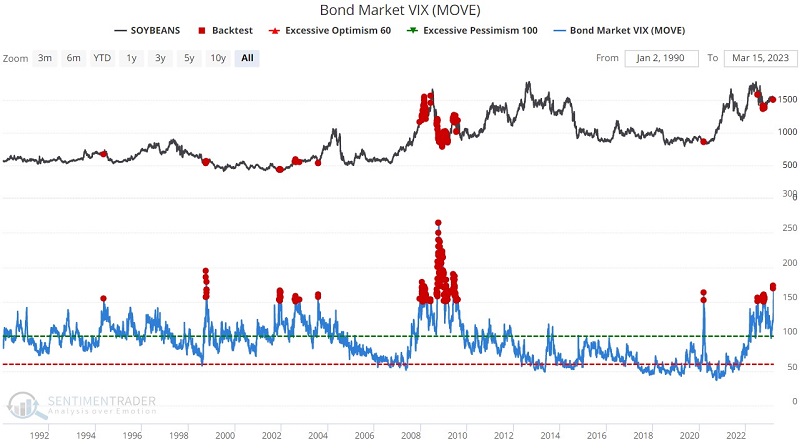
The chart and table below display Soybeans' performance anytime MOVE is greater than 150. Here too we see that overall the results are a coin-flip.
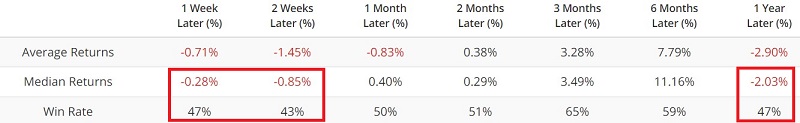
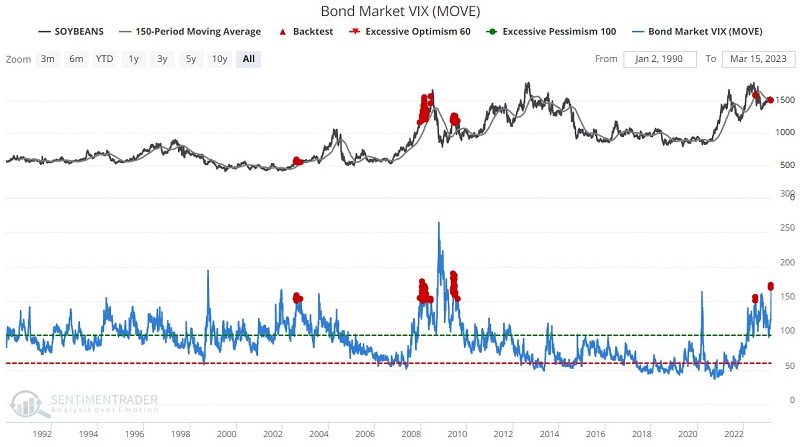
The chart and table below display Soybeans' performance anytime MOVE is greater than 150 and price is above its 150-day moving average. Note the extreme weakness six and twelve months after a signal.
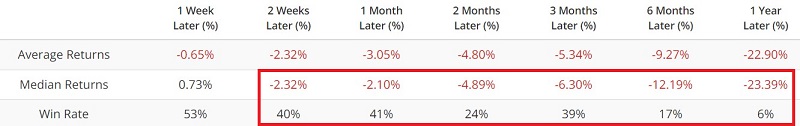
The chart and table below display Soybeans' performance anytime MOVE is greater than 150 and price is below its 150-day moving average.
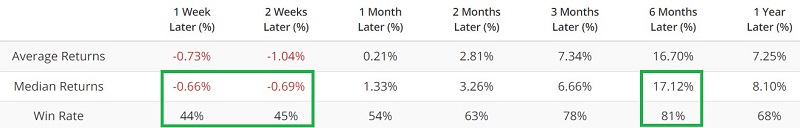
Soybeans showed awful results following MOVE 150+ readings when the price of soybeans was above the 150-day average. Six-month results, in particular, were much better if price was below the 150-day moving average.
What the research tells us…
The research appears to tell us is that volatility in the bond market may have a far-reaching ripple effect that extends far beyond bond prices. The cost of money is an important factor in determining how and where to allocate capital. When there is extreme volatility in the cost of money (i.e., MOVE readings above 150) it appears to trigger a reversal in price trends for t-bonds, gold and soybeans. Conversely, extreme bond volatility tends to confirm the existing trend in stocks. The US Dollar tends to exhibit weakness following any MOVE reading above 150, and has shown extreme weakness over the ensuing twelve months if the dollar was above its 150-day moving average at the time of the 150+ reading for MOVE.