
The Stock Replacement Strategy with Ticker XLF

In this piece, Dean wrote about a variety of signals involving the financial sector. A common vehicle for trading in the financial sector is ticker XLF (Financial Select Sector SPDR Fund).
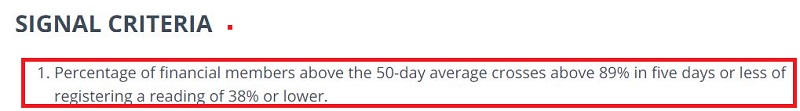
One that caught my eye involved the following simple setup.
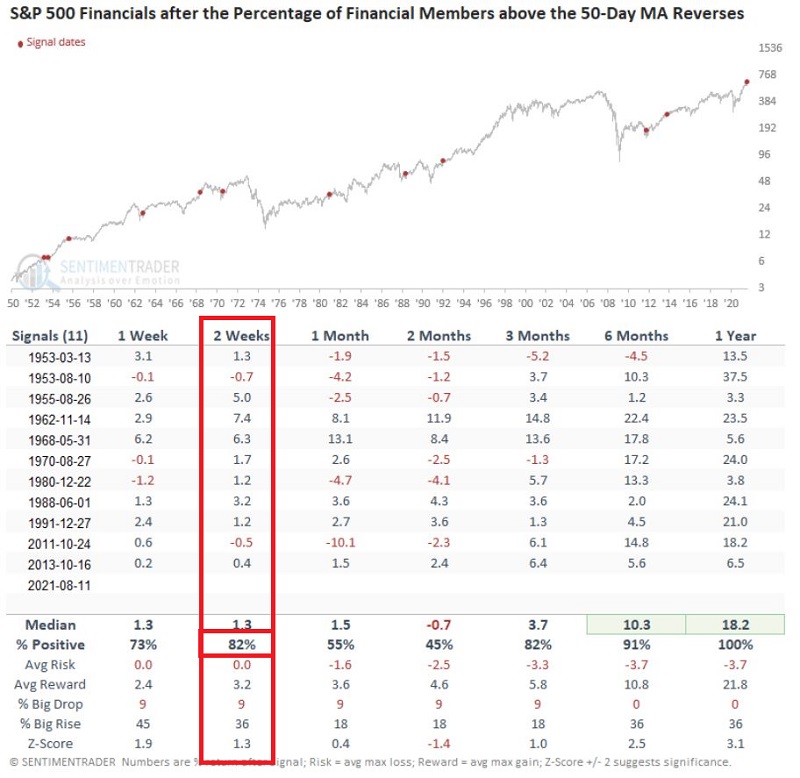
What really caught my eye was the 82% Win Rate over the 2 weeks following previous signals.
This represents a good opportunity to highlight something commonly referred to as the "Stock Replacement Strategy."
BUYING SHARES OF XLF
As always, what follows is intended as an educational example and not as specific trade "recommendations."
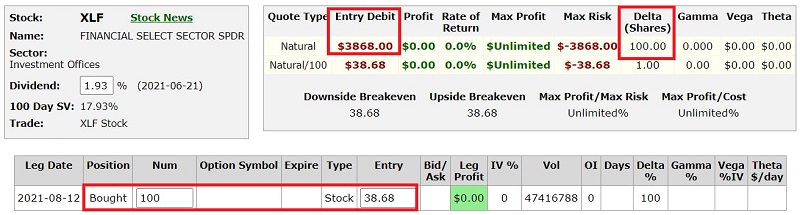
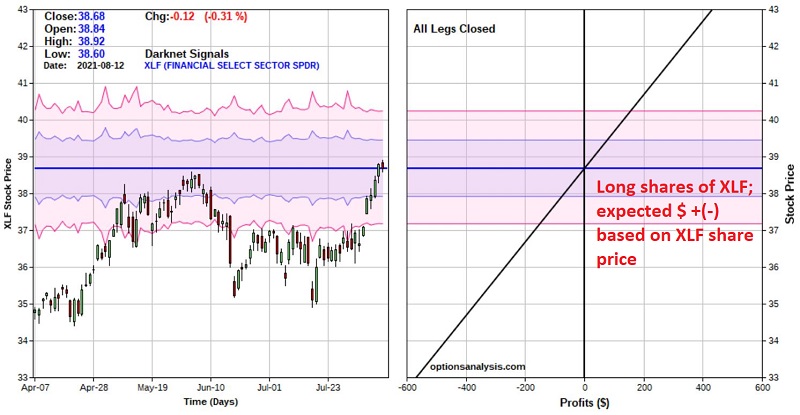
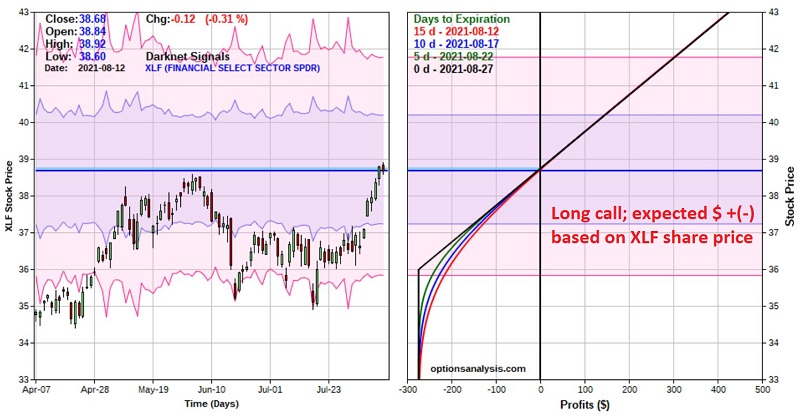
The underlying theory is that we have a bullish indication for ticker XLF over the next two weeks. The most straightforward approach to acting on this would be to buy 100 shares of ticker XLF. As you can see in the screenshot and risk curve chart below (courtesy of Optionsanalysis) - as this is written - buying 100 shares of XLF would cost $3,868. For each $1 in price that XLF shares rise or fall, this trade will make $100.
STOCK REPLACEMENT STRATEGY WITH XLF OPTIONS
The advantage of buying shares of XLF is that a trader can hold them beyond the two-week "favorable" period if desired. But for our purposes, we are assuming that we are focusing strictly upon generating a profit if XLF advances by some amount over the next two weeks.
This is a situation where it can make great sense to buy a deep-in-the-money call option instead of the shares of the underlying security (XLF in this case) itself. Consider the following example trade:
- Buy XLF Aug27 36 calls @ $2.74
The particulars appear in the screenshot below and the risk curves below that.
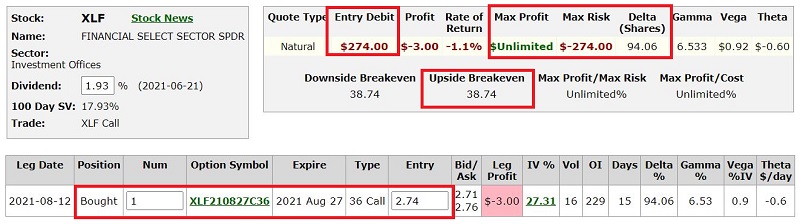
Things to note:
- The cost to enter this trade is only $274 (instead of $3,868 to buy 100 shares of XLF)
- The breakeven price on this trade is $38.74 (there is minimal time premium built into this option)
- The option has a "delta" of 94.06 (this means that it will behave similarly to a position of buying 94 shares of XLF but at a fraction of the cost)
- If XLF rallies above the breakeven of $38.74, this option will profit point-for-point with XLF shares
- If XLF falls apart and declines substantially, the worst case is a loss of $274
The chart below overlays the two positions (long 100 shares vs. long 1 Aug27 36 call).
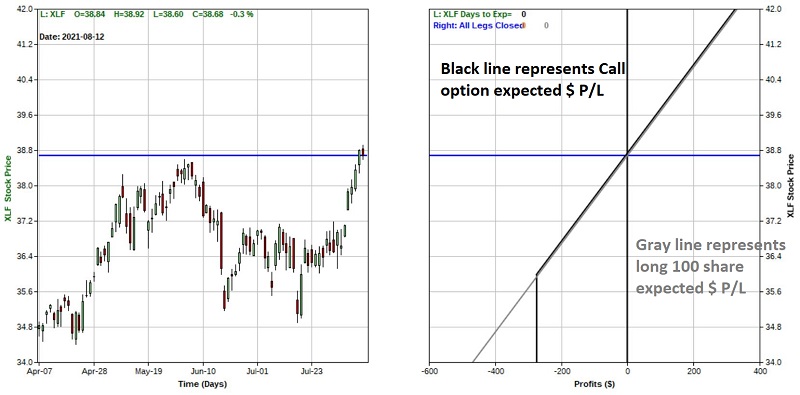
- Above $36 a share for XLF, the option trade will behave just like the long stock position (minus the $6 in time premium paid when buying the option)
- Below $36 a share for XLF, the stock position will continue to lose money, while the option can lose no more than $274
Consider:
If XLF were to rally 3% in the next two weeks (not a prediction, just a random number to use for illustrative purposes):
- Ticker XLF would rise from $38.68 a share to $39.84 a share
- Buying 100 shares of XLF at $38.68 would yield a profit of $116 (39.84-38.68 times 100 shares), or 3% on an investment and risk of $3,868
- Buying 1 36 strike price call option would yield a profit of $110 (stock price of 39.84 minus strike price of 36.00 minus price paid of 2.74 times 100 shares), or 40% on an investment ad risk of $274
Now let's say the unthinkable happens and XLF fall completely out of bed and collapses 15% in two weeks:
- Ticker XLF would fall from $38.68 a share to $32.88 a share
- Buying 100 shares of XLF at $38.68 would yield a loss of -$580 (32.88-38.68 times 100 shares), or -15% on an investment and risk of $3,868
- Buying 1 36 strike price call option would yield a loss of the entire $274 premium paid to buy the call option
SUMMARY
- Will XLF rally in the next two weeks? I can't say for sure.
- Is the "Stock Replacement Strategy" always a better alternative? Not necessarily.
- Which will prove to be the better trade two weeks from now - buying 100 shares of XLF, buying an in-the-money call option? Or taking no trade at all? Again, I can't say for sure.
But remember, the purpose of this piece is not to convince you to do something - or to not do something - with regards to ticker XLF.
The purpose is to alert you to a potentially cheaper alternative to buying shares in some circumstances that can offer:
- A lower cost of entry
- Similar profit potential
- Less downside risk
Ultimately, it may not be your "cup of tea." But if you are a trader, it is probably at least worth knowing about.