
The stock market's (sordid) September history

Key Points
- September has historically been the worst month for the stock market
- Factors that can affect performance are the four-year election cycle, the 20-year cycle, and whether the stock market is in an uptrend or downtrend entering September
- These factors presently suggest caution in September 2022
The Dow in September
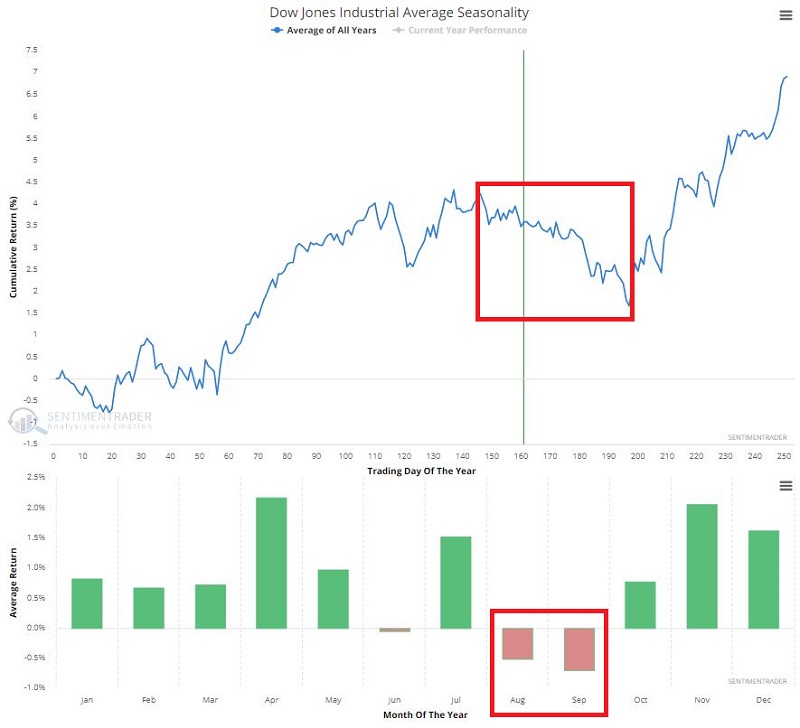
September has a bad reputation regarding the stock market, and deservedly so. Still, the reality is that the market can perform just fine in any given year during September. The chart below displays the annual seasonal trend for the Dow Jones Industrial Average and highlights the tendency for weakness during this time of year.
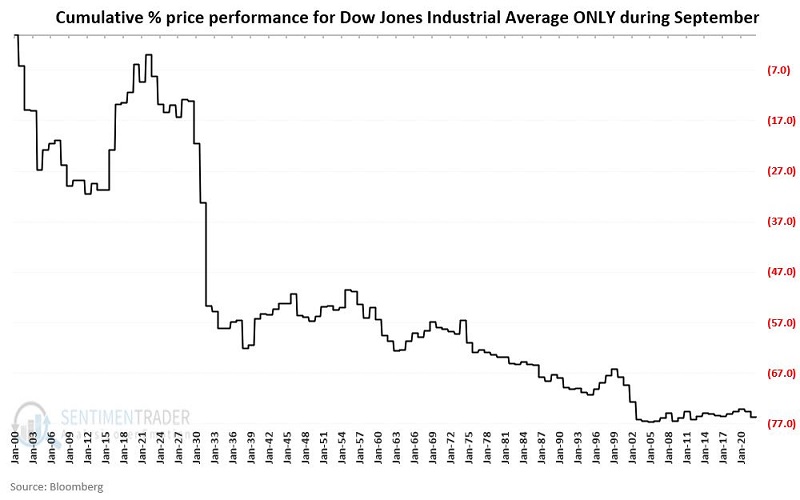
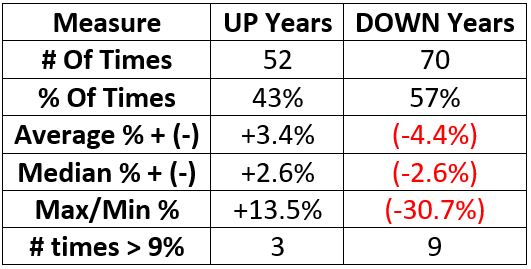
The chart below displays the cumulative % +(-) for the Dow Jones Industrial Average during September starting in 1900. The table below summarizes performance results.
The Dow in September based on trend
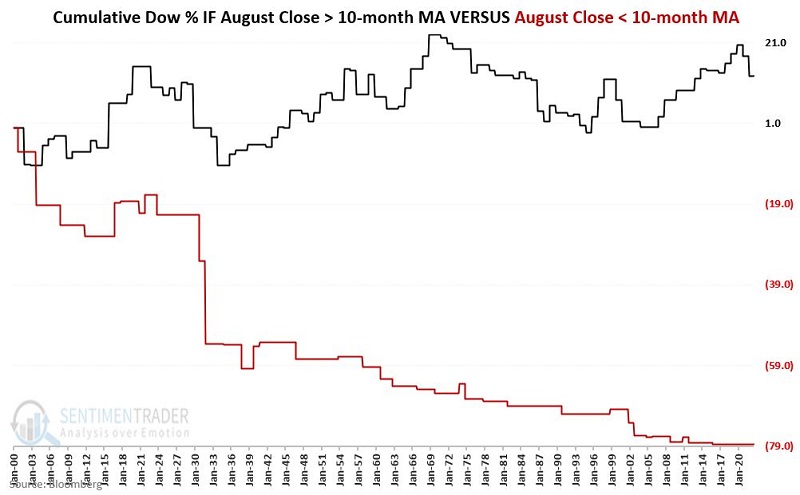
Let's break apart the results based on whether the Dow closed August above or below its 10-month moving average.
The black line in the chart below displays the cumulative % +(-) for the Dow Jones Industrial Average during September if the Dow closed August above its 10-month moving average.
The black line in the chart below displays the cumulative % +(-) for the Dow Jones Industrial Average during September if the Dow closed August below its 10-month moving average.
The table below summarizes performance results.
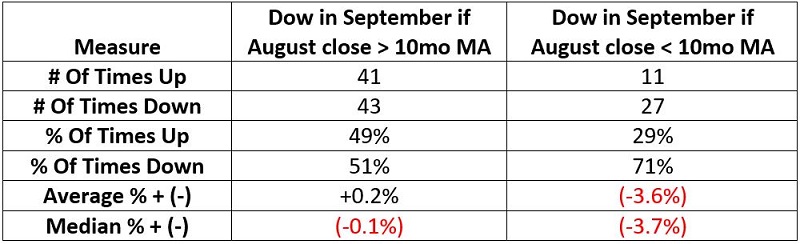
Under the category of "weakness tends to beget weakness", September performance has been notably worse when the market enters September already in a downtrend (i.e., with the Dow below its 10-month moving average). As this is written, the Dow is below its 10-month moving average. However, there is enough time left between now and the end of the month for that to change.
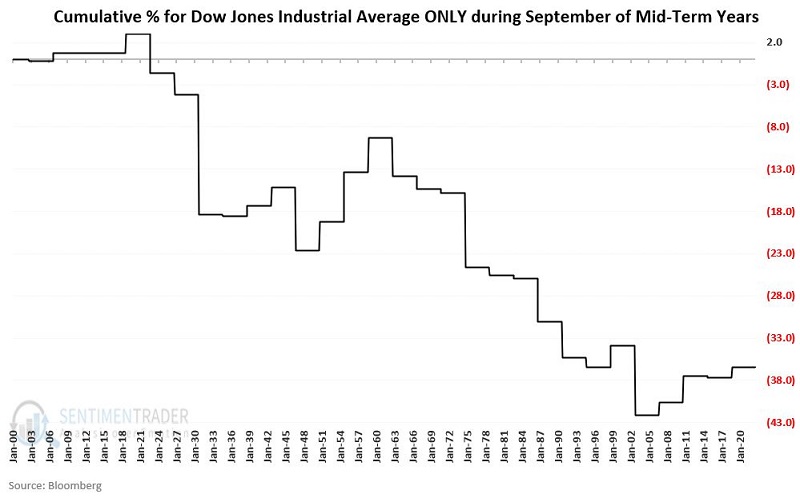
September in mid-term election years
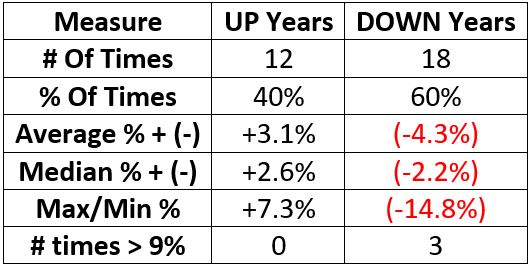
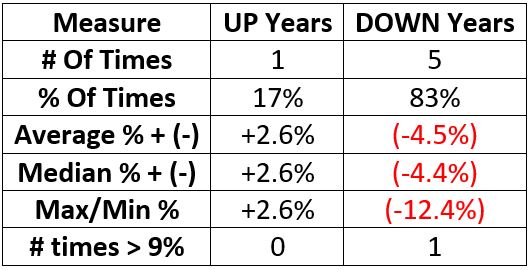
In the context of the four-year election cycle, 2022 is a mid-term election year. The chart below displays the cumulative % +(-) for the Dow Jones Industrial Average during September only during mid-term election years starting in 1902. The table below summarizes performance results.
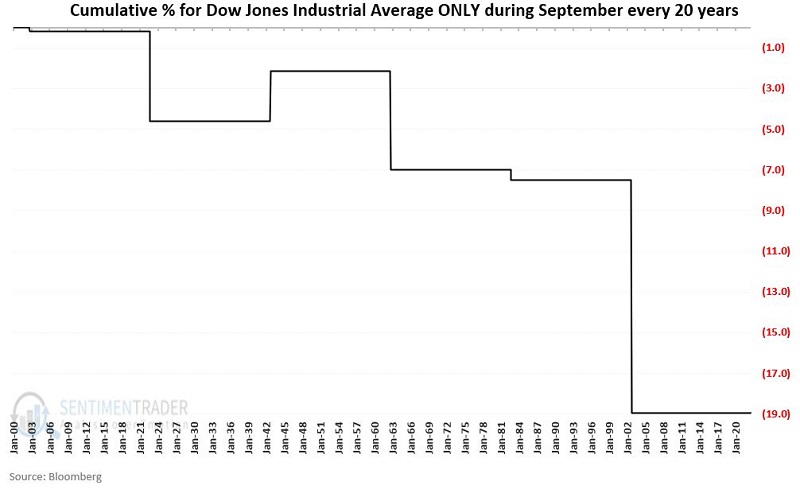
The Ugly 17 Months
As detailed in this article that analyzed monthly performance across complete twenty-year cycles, September 2023 ranks as one of the "Ugly 17 Months." The chart below displays the cumulative % +(-) for the Dow Jones Industrial Average during September every twenty years starting in 1902. The table below summarizes performance results.
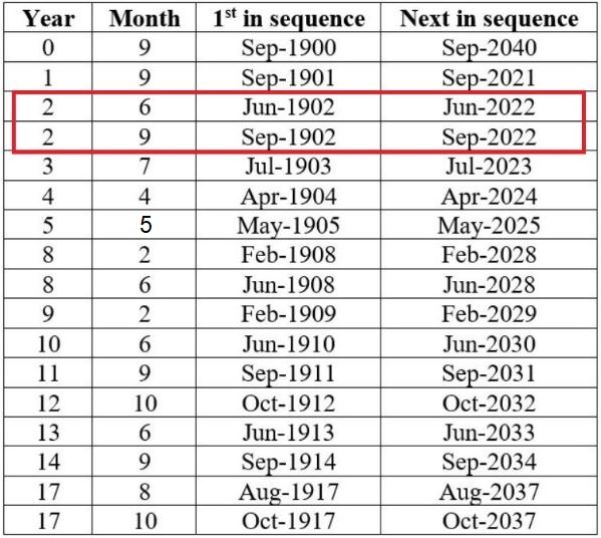
The test above is an admittedly small sample size. Still, it is essential to remember that September of 2022 is only one of seventeen months that have systematically underperformed during the past 120 years. The table below displays the sequence of months in this ominous club.
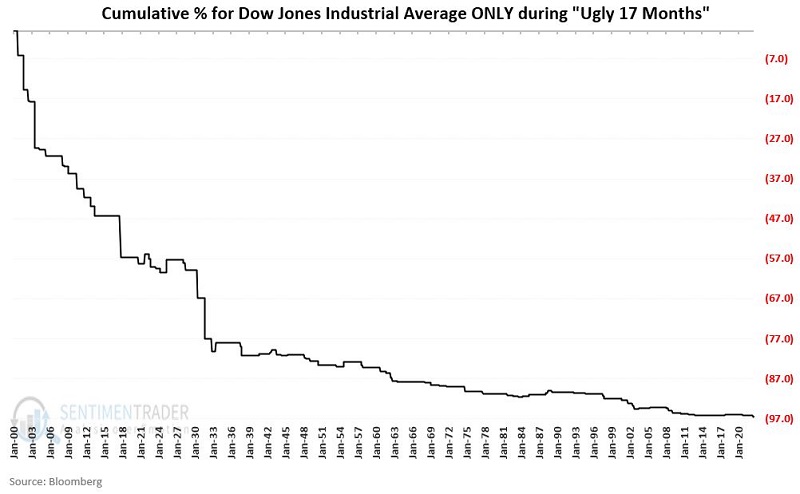
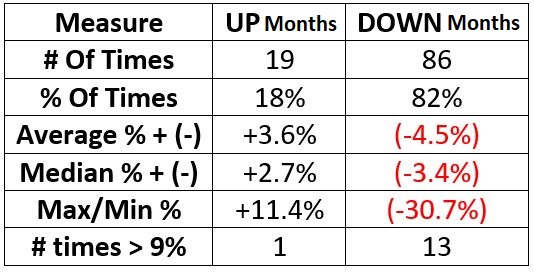
The chart below displays the cumulative % +(-) for the Dow Jones Industrial Average during the Ugly 17 months starting in 1900. The table below summarizes performance results.
What the research tells us…
The reality is that there is no reason that the stock market cannot enjoy a good performance during September 2022. Nevertheless, many historical tendencies strongly suggest that investors be prepared to play defense if weakness unfolds. The complete history of September's performance, plus the juxtaposition of this September within the four-year Presidential election cycle and the 20-year cycle, urge caution. The outlook becomes even more concerning if the Dow closes August below its 10-month moving average.
The best advice for the month ahead is "hope for the best, prepare for the worst."