
The stock market meets Valentine's Day

Key Points
- The stock market celebrated Valentine's Day by closing the day with a 4% year-to-date gain for the S&P 500 Index
- Gains of 3% or more by Valentine's Day have historically been a favorable sign for the rest of the year
- Post-Valentine Day performance has lagged significantly during other years
A substantial gain by Valentine's Day as a bellwether for the rest of the year
The S&P 500 closed on 2025-02-14 with a year-to-date gain of +4.0%. Historically, gains of 3% or more by February 14th have been a positive sign for stock prices during the remainder of the year. For the record, I learned of this seasonal phenomenon from Ryan Detrick, Chief Market Analyst at Carson Group LLC.
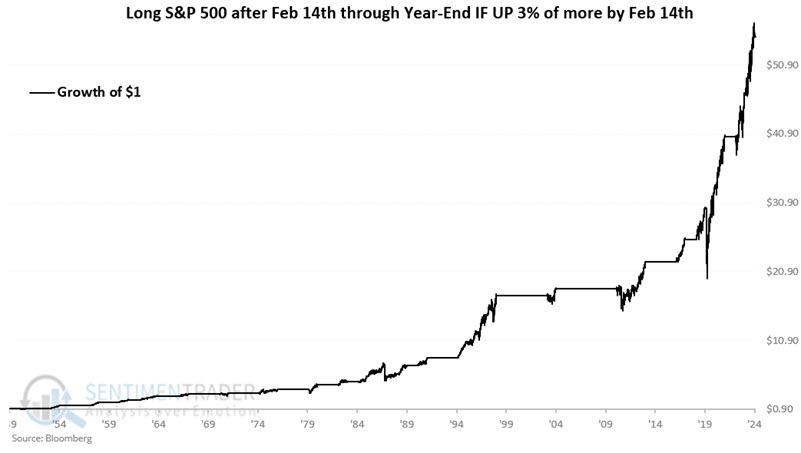
The chart below displays the hypothetical growth of $1 invested in the S&P 500 post-Valentine's Day through the end of the year, only during those years when the S&P 500 was up by 3% or more by Valentine's Day. A hypothetical initial $1 grew to $55.00.
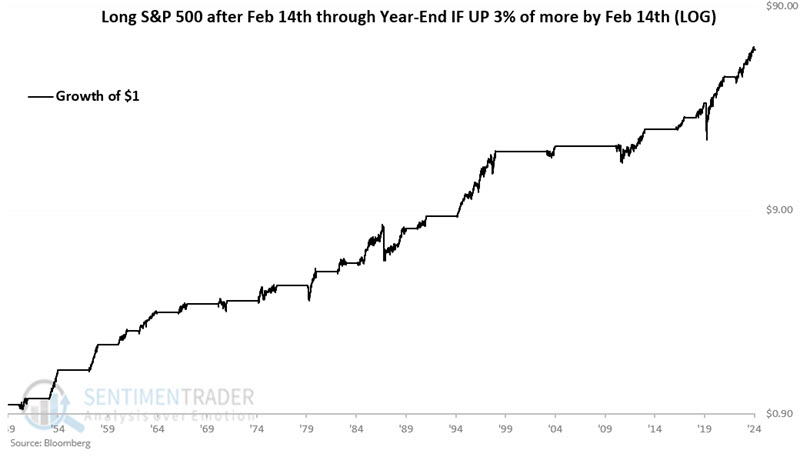
The chart below displays the same results on a logarithmic scale.
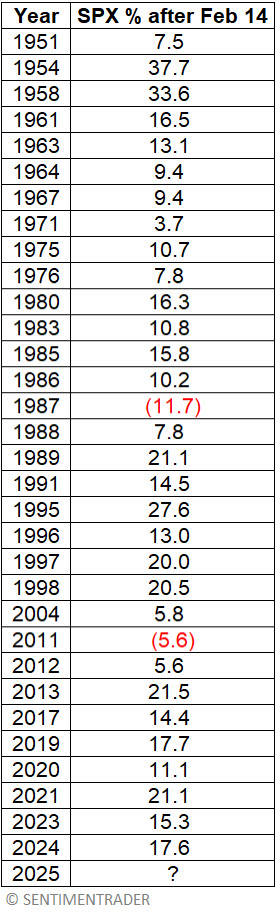
The table below displays the performance of the S&P 500 from Valentine's Day through the end of the year, only during those years when the S&P 500 was up by 3% or more by Valentine's Day.
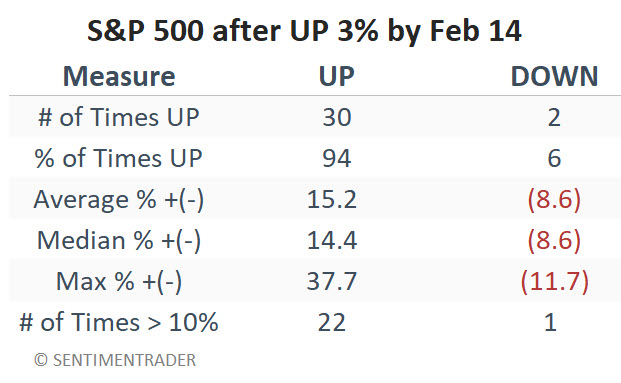
The table below summarizes performance.
Post-Valentine's performance during all other years
For comparison, let's look at the post-Valentine's Day performance for the S&P 500 during all years when the index was not up 3% or more by February 14th.
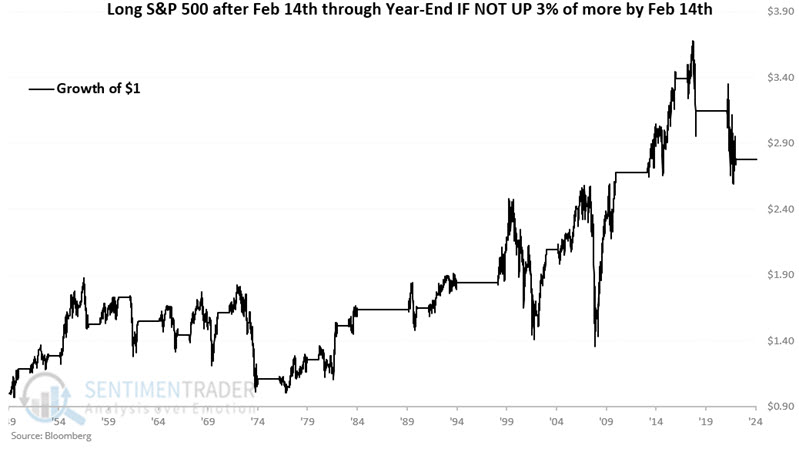
The chart below displays the hypothetical growth of $1 invested in the S&P 500 post-Valentine's Day through the end of the year, only during those years when the S&P 500 was not up by 3% or more by Valentine's Day. A hypothetical initial $1 grew to $2.78
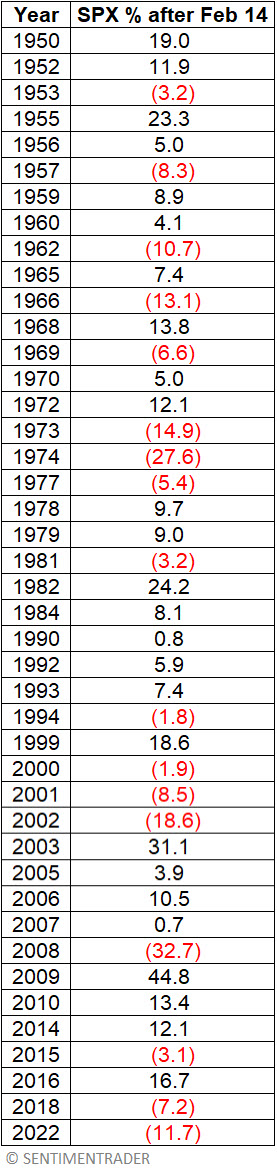
The table below displays the performance of the S&P 500 post-Valentine's Day through the end of the year, only during those years when the S&P 500 was not up by 3% or more by Valentine's Day.
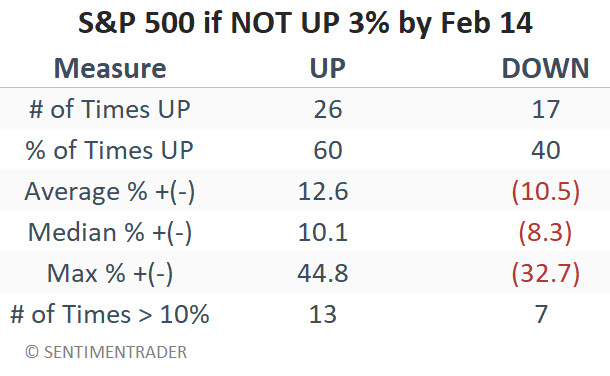
The table below summarizes performance.
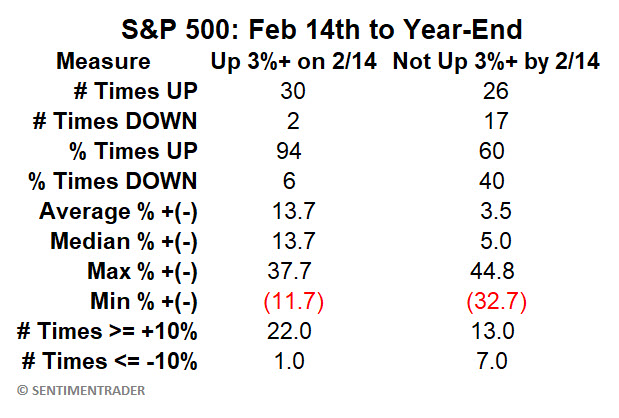
The table below compares favorable period (February 14th to year-end IF SPX >= +3% YTD) performance to unfavorable period (February 14th to year-end IF SPX < +3% YTD) performance head-to-head.
What the research tells us...
The January Model, January Model Signal, and YTD performance through Valentine's Day argue that there is some link between early-year strength and continued strength through the end of the year. Post Valentine's Day performance following a 3%+ gain has clearly been better overall than during other years. Is there truly a "cause-and-effect" relationship? Make whatever argument you'd like - the numbers are what they are. Another potential fly in the ointment is that there is no guarantee that 2025 will follow historical precedent and move higher between Valentine's Day and the end of the year. Still, if nothing else, history suggests giving the bullish case the benefit of the doubt until there is a reason to doubt it.