Data &
Technology
Research
Reports
Report Solutions
Reports Library
Actionable
Strategies
Free
Resources
Simple Backtest Calculator
Simple Seasonality Calculator
The Kelly Criterion Calculator
Sentiment Geo Map
Public Research Reports
Free Webinar
Pricing
Company
About
Meet Our Team
In the News
Testimonials
Client Success Stories
Contact
Log inLoginSign up
< BACK TO ALL REPORTS

The spread in sentiment between Smart and Dumb Money is historic

Jason Goepfert
2021-12-08
There is a historic spread in sentiment between Smart and Dumb Money. The Kospi has given a buy signal. Taking a look at relative market trends.

Historic spread between Smart and Dumb Money

The past couple of weeks has triggered a drastic shift in sentiment. The confidence in a rally among Smart Money indicators has jumped. It would be even more extreme if there wasn't a curiously large plunge in "smart money" commercial hedger positions in equity index futures.

We can see the stark change in attitude below. Despite the weird increase in a net short position in index futures, Smart Money Confidence jumped to 77%, the highest since late April 2020. Dumb Money Confidence plunged to 30%, the lowest since early April 2020.

Smart Money vs Dumb Money Confidence is at an extreme

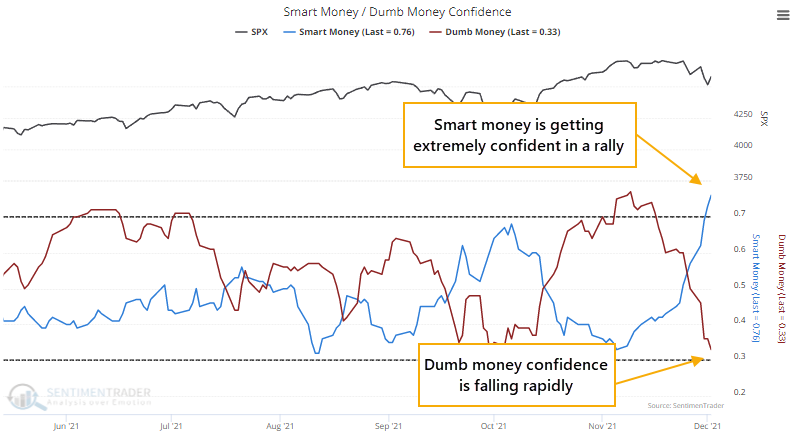
This adjustment in behavior has caused the spread between them to rise above 45%. The S&P 500's annualized return when the spread is above 45% was +52.6%, nearly 10x the return when sentiment was neutral.

Stat box

Fewer than 10% of Consumer Staple stocks were above their 10-day moving averages only 3 days ago, now more than 90% of them are. The sector has enjoyed such a quick rebound in short-term trends only 3 other times - Nov 30, 2011, Jan 2, 2013, and Oct 21, 2014.


A buy signal from the Kospi

A new signal from a mean reversion model that utilizes the percentage of KOSPI index members below their lower Bollinger band registered an alert on Monday. 

Dean noted that the Bollinger band signal identifies when the percentage of index members trading below their lower Bollinger band cycles from a high to a low level. The percentage of KOSPI members below their lower Bollinger band recently increased to the 7th highest level in history.

Kospi members are recovering from outside their Bollinger Band

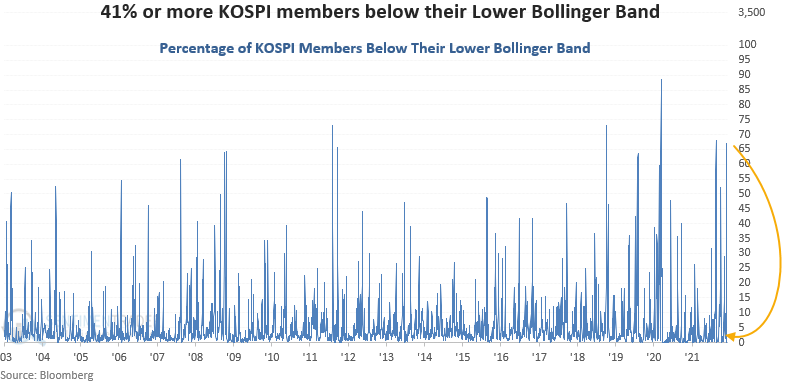
This signal has triggered 19 other times over the past 18 years. After the others, future returns and win rates were good on medium-term time frames. 

Relative trends mostly remain in force

Jay highlighted relative trends in and among stock indexes, assets, and bonds.

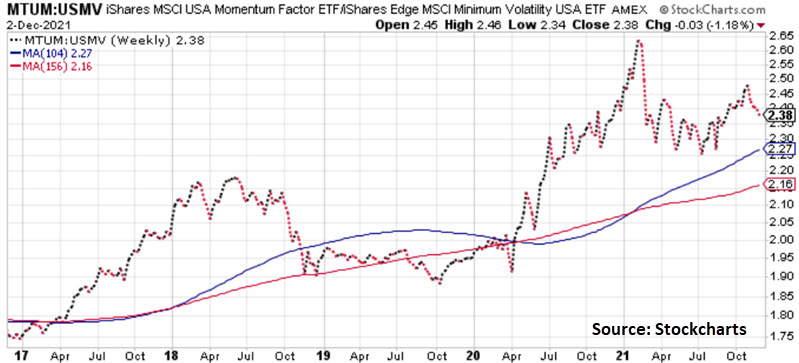
The example chart below shows MTUM (iShares MSCI USA Momentum Factor ETF) versus USMV (iShares Edge MSCI Minimum Volatility ETF). Typically, momentum stocks outperform during bullish market conditions, and low volatility stocks outperform during bearish market conditions. The longer-term trend still favors momentum stocks. However, low volatility has gained ground since early 2021, and the relationship has been unchanged from 13 months ago. Watch this one for a potential early warning sign.

Sentiment has whipsawed quickly over the past month, from extreme optimism to some signs of extreme pessimism. Most of the intermarket relationships that have been in force for the last year remain in force, however. At some point, the domination of U.S. Large-Cap stocks will end, but so far there is little sign of it.

DATA &
TECHnologies
IndicatorEdge
‍
BackTestEdge
‍
Other Tools
‍
DataEdge API
RESEARCH
reports
Research Solution
‍
Reports Library
‍
actionable
Strategies
Trading Strategies
‍
Smart Stock Scanner
‍
FREE
RESOUrCES
Simple Backtest
Calculator
Simple Seasonality
Calculator
The Kelly Criterion
Calculator
Sentiment Geo Map
‍
Public Research Reports
‍
Free Webinar
COMPANY
‍
About
‍
Meet our Team
‍
In the News
‍
Testimonials
‍
Client Success Stories
Pricing
Bundle pricing
‍
Announcements
‍
FAQ
© 2024 Sundial Capital Research Inc. All rights reserved.
Setsail Marketing
TermsPrivacyAffiliate Program
Risk Disclosure: Futures and forex trading contains substantial risk and is not for every investor. An investor could potentially lose all or more than the initial investment. Risk capital is money that can be lost without jeopardizing ones’ financial security or life style. Only risk capital should be used for trading and only those with sufficient risk capital should consider trading. Past performance is not necessarily indicative of future results.

Hypothetical Performance Disclosure: Hypothetical performance results have many inherent limitations, some of which are described below. No representation is being made that any account will or is likely to achieve profits or losses similar to those shown; in fact, there are frequently sharp differences between hypothetical performance results and the actual results subsequently achieved by any particular trading program. One of the limitations of hypothetical performance results is that they are generally prepared with the benefit of hindsight. In addition, hypothetical trading does not involve financial risk, and no hypothetical trading record can completely account for the impact of financial risk of actual trading. for example, the ability to withstand losses or to adhere to a particular trading program in spite of trading losses are material points which can also adversely affect actual trading results. There are numerous other factors related to the markets in general or to the implementation of any specific trading program which cannot be fully accounted for in the preparation of hypothetical performance results and all which can adversely affect trading results.

Testimonial Disclosure: Testimonials appearing on this website may not be representative of other clients or customers and is not a guarantee of future performance or success.