
The S&P suffers a weekly reversal, then enjoys a daily one

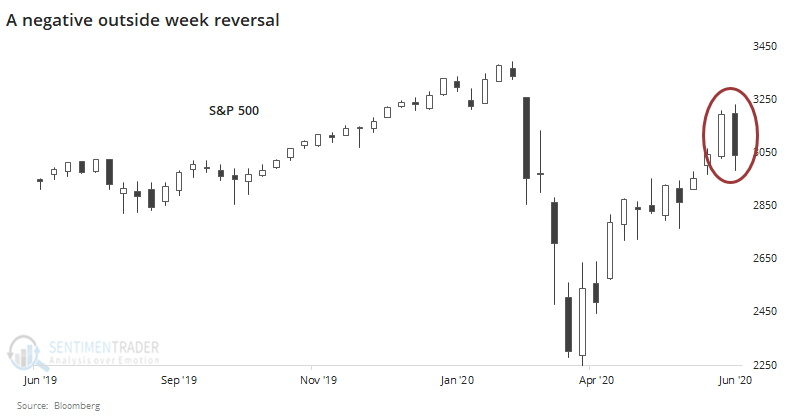
Based on price action alone, last week did not look promising for the most benchmarked index in the world. It suffered what most would consider a negative outside reversal week, typically taken as a sign of exhausted buyers.
To clarify exactly what we're looking at, we can go back to 1962 and look for any week that had:
- A higher high than the prior week
- A lower low than the prior week
- A lower close than the prior week
Using those definitions, we get the following returns going forward. To wrap some context around the reversals, we'll only include those weeks where the high was the highest in at least 12 weeks, but not so high that it was the highest in the past 52 weeks. These capture medium-term rallies within longer-term falling or gyrating markets.
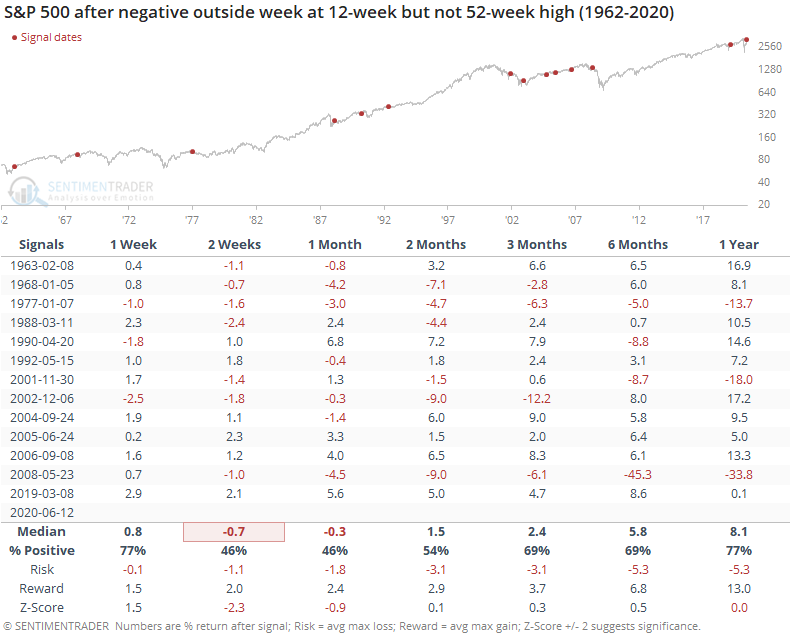
These patterns were decent at showing a slight headwind in the shorter-term. Up to two months later, risk was higher than reward, but overall returns were about in line with random after the first month. There also was not a consistent bias toward weakness after that first month. We'd rate the pattern as a slight shorter-term negative, but nothing beyond that.
Thanks perhaps to the latest Federal Reserve announcement on buying individual bonds, the S&P enjoyed a very large positive reversal, not quite an "outside up day" but it was close. It erased more than a 2% decline to close positive on the day.
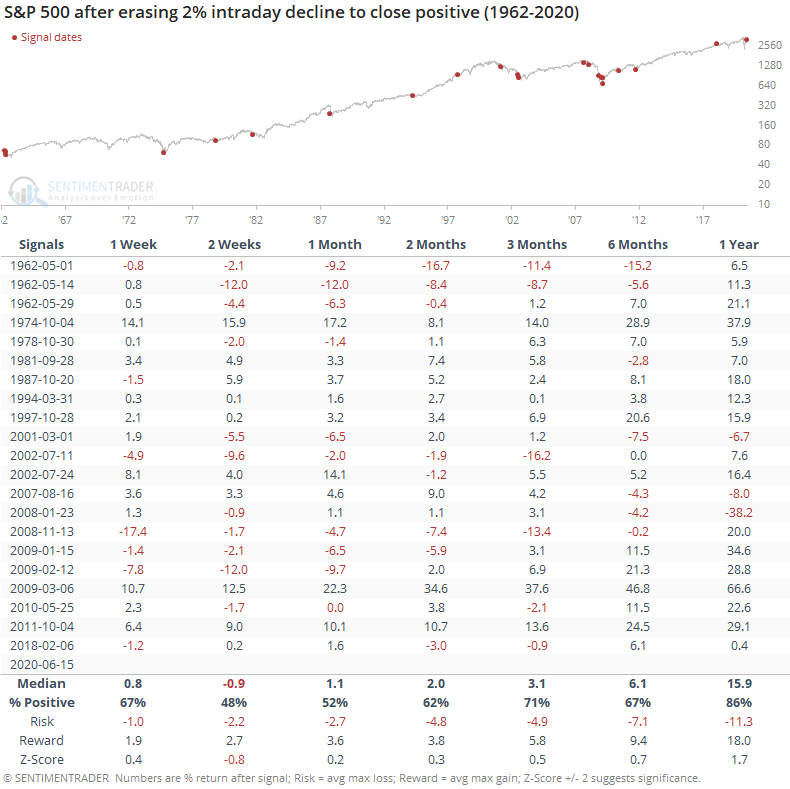
While it always looks impressive on a chart and gets people excited, it wasn't that great of a predictor. Returns over the next two weeks were negative, then slightly positive. Across most time frames, it wasn't far from random, with a z-score below 1 up to six months later.
Overall, there isn't much here to get too excited about on a daily basis, and maybe just a little bit to get negative about over the next couple of weeks.