Data &
Technology
Research
Reports
Report Solutions
Reports Library
Actionable
Strategies
Free
Resources
Simple Backtest Calculator
Simple Seasonality Calculator
The Kelly Criterion Calculator
Sentiment Geo Map
Public Research Reports
Free Webinar
Pricing
Company
About
Meet Our Team
In the News
Testimonials
Client Success Stories
Contact
Log inLoginSign up
< BACK TO ALL REPORTS

The S&P 500's Summation Index is in the Worst Possible Position

Jason Goepfert
2021-10-11
Poor internal participation has knocked the S&P 500's McClellan Summation Index below zero for the first time in over a year. That was one of its longest streaks since 1926. The ends of other persistent positive trends have typically led to a resumption of the uptrend.

At various points this year, the majority of stocks have trailed the major indexes. Sometimes, there was a wide divergence between what the average stock was doing versus, say, the S&P 500. Historically, that has preceded declines in the indexes, but 2021 has thrown a whole host of historical markers out the window.

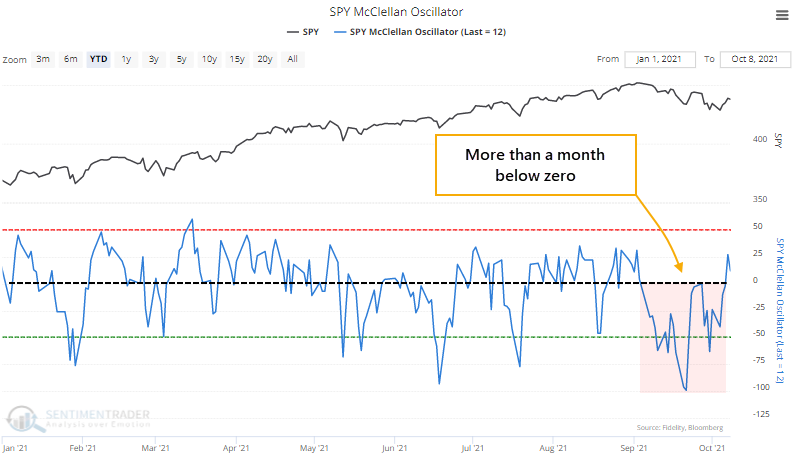
Even so, the internal weakness was enough so that when the S&P actually did start to struggle over a month ago, some of its breadth metrics really struggled. The rally at the tail end of last week started to change that; the McClellan Oscillator for the S&P 500 has turned positive for the first time in a month.

The extended run below zero in the Oscillator caused the longer-term Summation Index to plunge, and it recently dived below its zero line for the first time in well over a year. The worst possible scenario for an index or sector is when its Summation Index is negative and declining - that's when the ugliest selloffs tend to occur. 

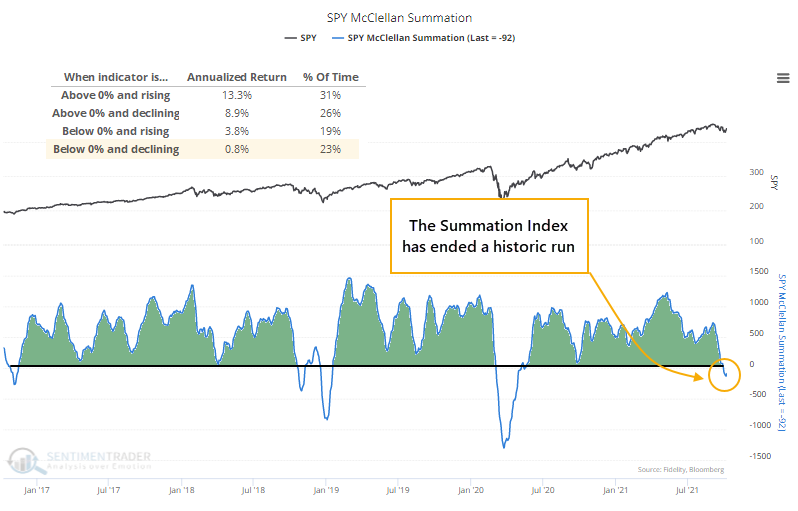
We can see the stark differences in annualized returns in the S&P 500 since 1926 based on various regimes in its Summation Index, and we're currently mired in the worst tranche. It's trying to curl up now, which helps, but we could breathe easier if it manages to keep rising and crosses above the zero line.

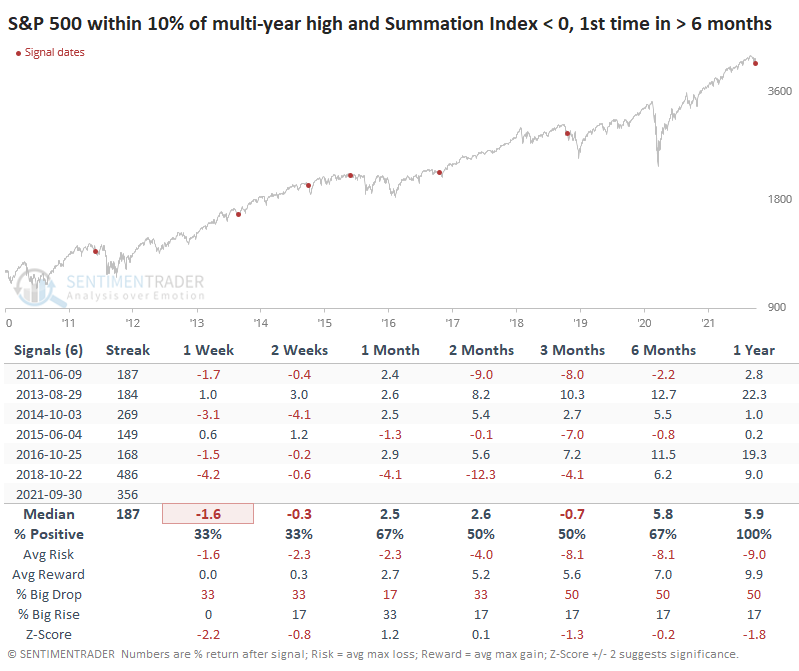
The drop below zero ended the 4th-longest streak in positive territory for the Summation Index since 1926, and it missed making it into 2nd place by only a few sessions.

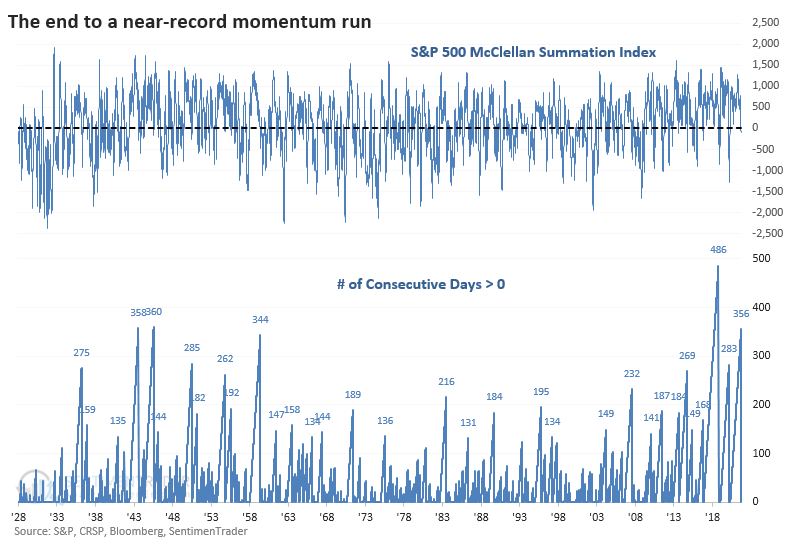
The longest streak ended in 2018, almost exactly three years ago, and ushered in some quick and painful losses. That was more the exception than the rule, though. After other long positive streaks ended, the S&P tended to show positive returns going forward, better than average returns, with generally small losses. Over the next three months, there were only two losers larger than -5%.

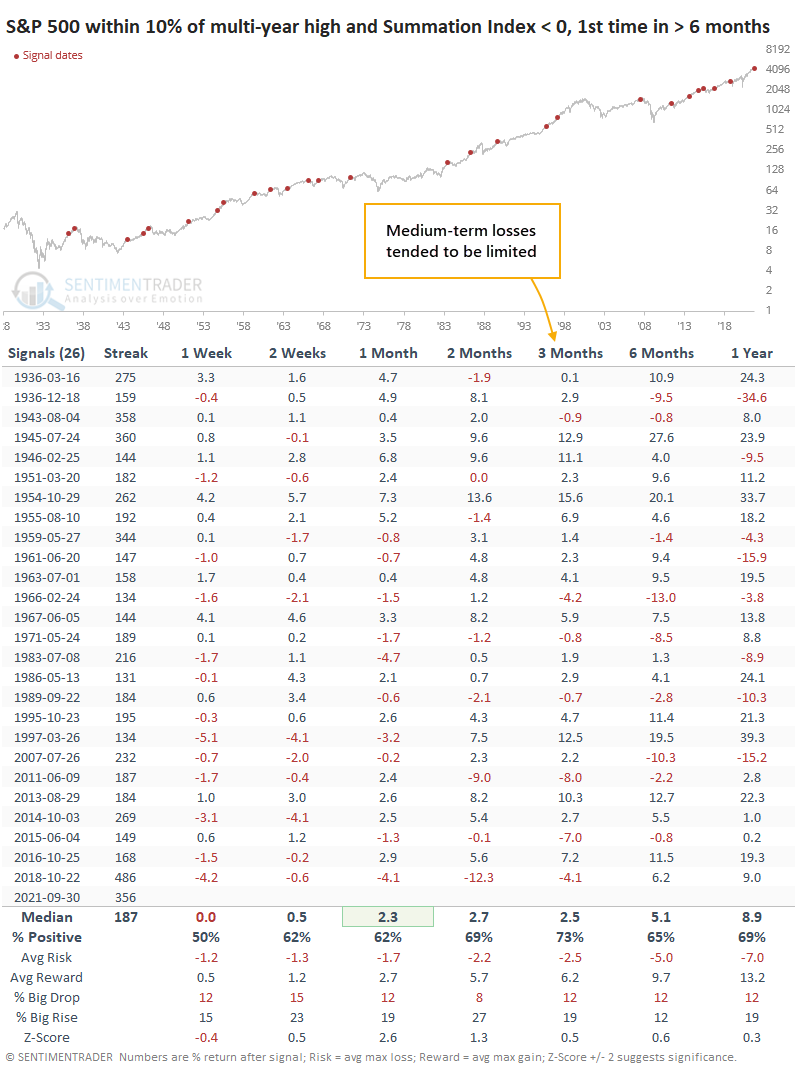
If we focus on the handful of signals since the global financial crisis, we can see more of a struggle. After these long positive streaks ended, the S&P fell into correction mode three times and quickly resumed its uptrend three times. That's a wash.

Over the past week, we've looked multiple times at the ends of long streaks of positive momentum. To a one, they showed a positive expectation going forward. After a long time with positive trends and internals, buyers have had a powerful tendency to see the first real pullback as an opportunity. We're amid that "opportunity" now, with solid seasonal trends as a tailwind. The following 2-3 weeks could (and should) be volatile as earnings come into focus and investors get more of a read on the spike in energy prices and potential contagion from foreign debt issues. But looking at the next 2-3 months, the bias should be higher unless something drastic has shifted in the market environment.

DATA &
TECHnologies
IndicatorEdge
‍
BackTestEdge
‍
Other Tools
‍
DataEdge API
RESEARCH
reports
Research Solution
‍
Reports Library
‍
actionable
Strategies
Trading Strategies
‍
Smart Stock Scanner
‍
FREE
RESOUrCES
Simple Backtest
Calculator
Simple Seasonality
Calculator
The Kelly Criterion
Calculator
Sentiment Geo Map
‍
Public Research Reports
‍
Free Webinar
COMPANY
‍
About
‍
Meet our Team
‍
In the News
‍
Testimonials
‍
Client Success Stories
Pricing
Bundle pricing
‍
Announcements
‍
FAQ
© 2024 Sundial Capital Research Inc. All rights reserved.
Setsail Marketing
TermsPrivacyAffiliate Program
Risk Disclosure: Futures and forex trading contains substantial risk and is not for every investor. An investor could potentially lose all or more than the initial investment. Risk capital is money that can be lost without jeopardizing ones’ financial security or life style. Only risk capital should be used for trading and only those with sufficient risk capital should consider trading. Past performance is not necessarily indicative of future results.

Hypothetical Performance Disclosure: Hypothetical performance results have many inherent limitations, some of which are described below. No representation is being made that any account will or is likely to achieve profits or losses similar to those shown; in fact, there are frequently sharp differences between hypothetical performance results and the actual results subsequently achieved by any particular trading program. One of the limitations of hypothetical performance results is that they are generally prepared with the benefit of hindsight. In addition, hypothetical trading does not involve financial risk, and no hypothetical trading record can completely account for the impact of financial risk of actual trading. for example, the ability to withstand losses or to adhere to a particular trading program in spite of trading losses are material points which can also adversely affect actual trading results. There are numerous other factors related to the markets in general or to the implementation of any specific trading program which cannot be fully accounted for in the preparation of hypothetical performance results and all which can adversely affect trading results.

Testimonial Disclosure: Testimonials appearing on this website may not be representative of other clients or customers and is not a guarantee of future performance or success.