
The S&P 500 triggered a breadth thrust

Key points:
- S&P 500 advancing issues outpaced declining issues by a ratio of 2.05 to 1, prompting a thrust signal
- Comparable breadth thrusts saw the S&P 500 rally 90% of the time over the following two months
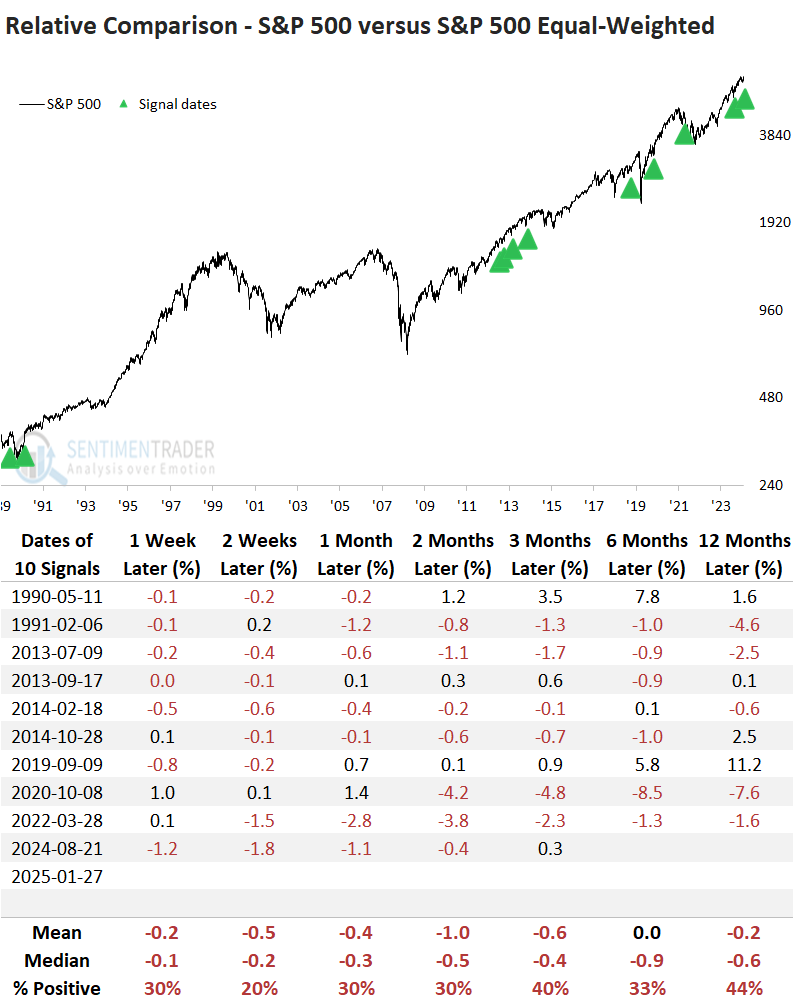
- After similar signals, the S&P 500 consistently underperformed the equal-weighted S&P 500
A breadth thrust confirms the underlying strength in the average stock
In a day that defies historical precedent, the S&P 500 fell 1.46% even as 347 of its components advanced compared to 149 that declined-a scenario never observed since 1928. This anomaly underscores the significant impact of a handful of stocks in the index, a topic in our latest webinar.
Amid the frenzy over the sharp decline in AI-related stocks, the market's broader strength went largely unnoticed.
Over the past ten sessions, the average stock has been advancing, pushing the 10-day cumulative ratio of advancing to declining issues above 2.02 and triggering a breadth thrust. While such signals are typically most valuable following significant corrections or bear markets, their appearance near a high, as seen now, confirms the bullish market environment already in place.
A member of the TCTM Composite Thrust Model, the previous signal occurred in August 2024, resulting in a 4% gain over the subsequent two months.
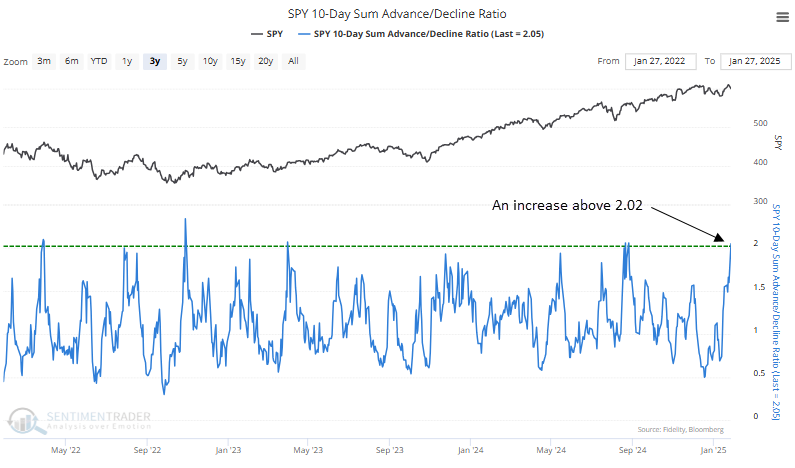
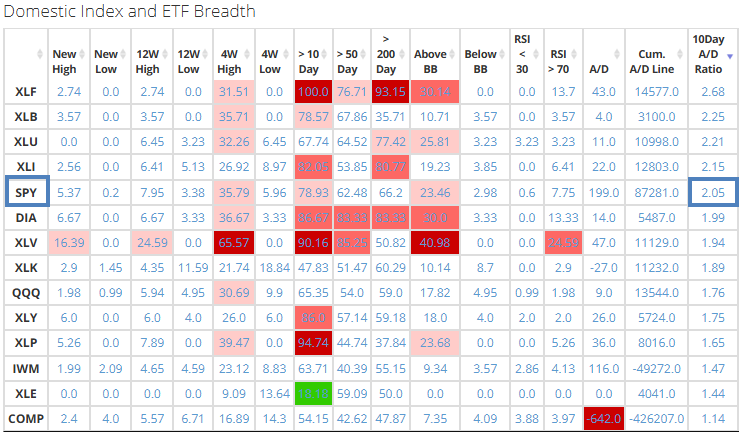
Website subscribers can track the 10-Day A/D Ratio indicator on the Market Breadth page under the spotlights section. Several sectors, including financials, materials, utilities, and industrials, displayed ratios above the S&P 500's 2.05, as detailed in the table below, highlighting their superior breadth relative to the broader market.
If you want a copy of the breadth thrust signal to save in your backtest engine favorites folder, click here.
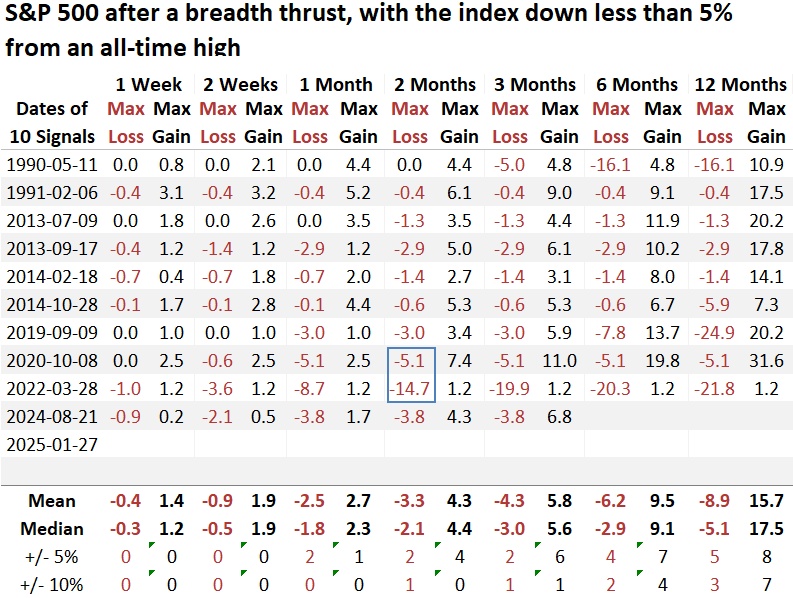
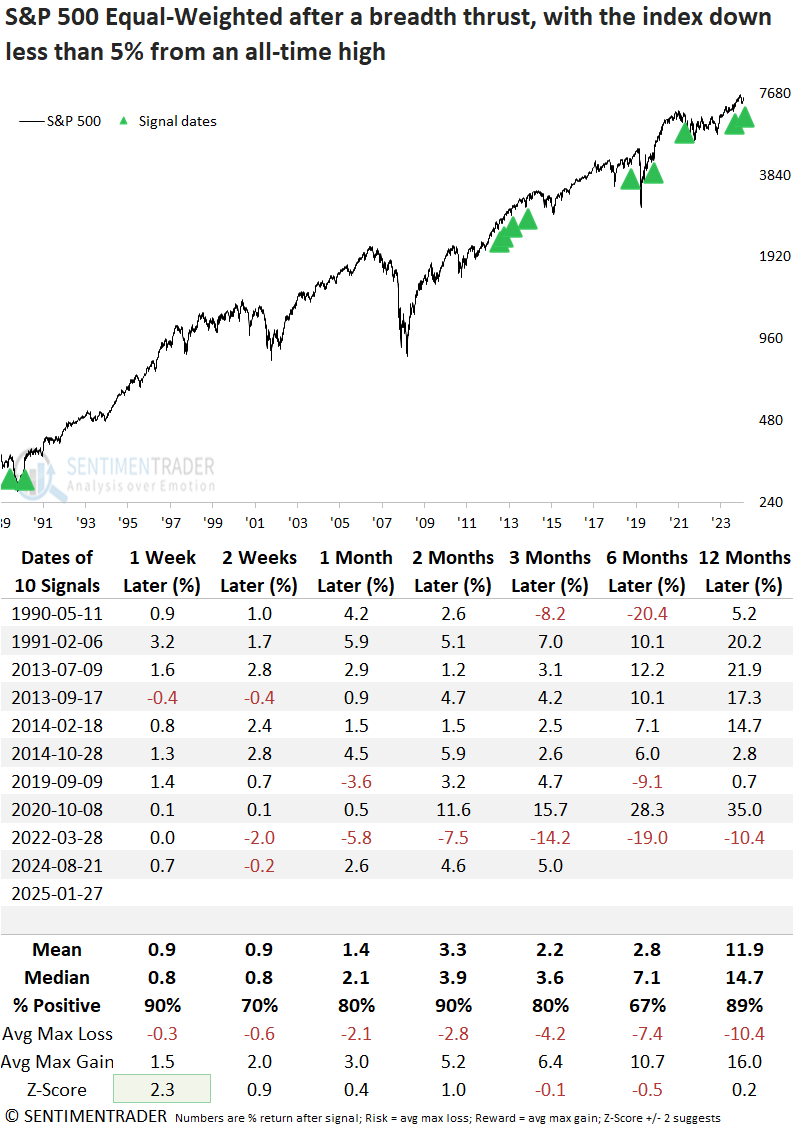
Comparable breadth thrusts preceded positive returns
Although infrequent, breadth thrusts that occurred within 5% of a record high yielded solid returns and remarkable reliability, with the two-month period standing out as a nearly perfect performer, with gains in all but one precedent.
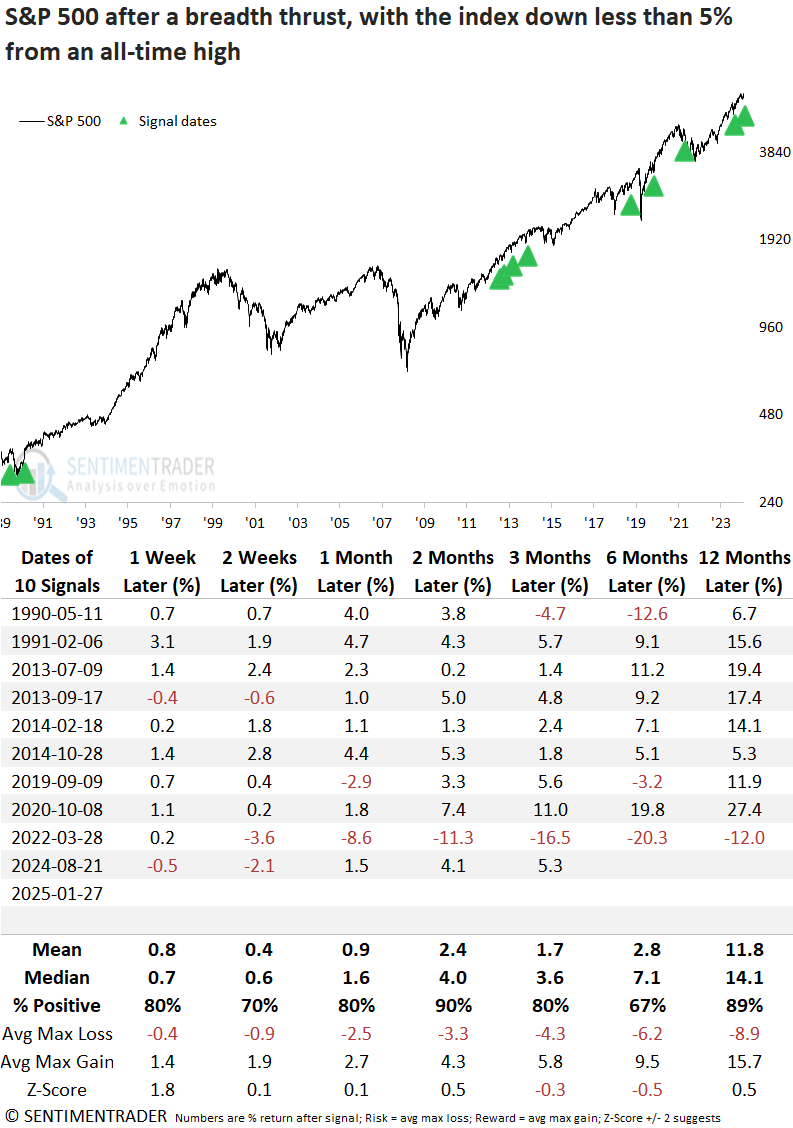
A maximum loss exceeding 5% occurred in two of the ten scenarios during the first two months, while only one instance saw a drawdown surpassing 10%.
With a handful of stocks exerting significant influence on the cap-weighted S&P 500, let's assess the outlook for the equal-weighted index. As expected, returns and consistency mirror the bullish outlook displayed by the cap-weighted index.
From a relative perspective, the cap-weighted S&P 500 consistently underperformed the equal-weighted version across all time frames. Given that the concentration issue emerged after COVID-19, it's worth noting that the S&P 500 has lagged behind the equal-weighted measure in every instance since 2020.
What the research tells us...
The S&P 500 triggered a breadth thrust when advancing issues outnumbered declining issues by a ratio of 2.02 to 1 over ten sessions, indicating broad participation. Comparable signals within 5% of an all-time high produced excellent returns and consistency, especially over the subsequent two months, with the S&P 500 rising 90% of the time. Although Monday's events were undoubtedly unsettling, particularly for investors heavily exposed to the AI theme, they serve as a crucial reminder of the inherent risks in markets and the importance of disciplined risk management and portfolio diversification for long-term success. With participation expanding, now is the time to broaden your view.