Data &
Technology
Research
Reports
Report Solutions
Reports Library
Actionable
Strategies
Free
Resources
Simple Backtest Calculator
Simple Seasonality Calculator
The Kelly Criterion Calculator
Sentiment Geo Map
Public Research Reports
Free Webinar
Pricing
Company
About
Meet Our Team
In the News
Testimonials
Client Success Stories
Contact
Log inLoginSign up
< BACK TO ALL REPORTS

The S&P 500 is uncorrelated with...itself

Jason Goepfert
2020-09-02
Daily moves in the S&P 500 index have becoming less correlated to the breadth of movement in its underlying stocks to the 2nd-most extreme degree in 30 years. There is also a near-record negative correlation between value and growth stocks. Only the year 2000 can match this type of odd behavior.

We saw on Monday that the correlation between the S&P 500 index that everyone watches and its equal-weighted cousin had broken down. The two versions of the same index are moving less together than at almost any point in the past 30 years, due to the by now well-documented dominance of the very large tech stocks, and otherwise poor breadth.

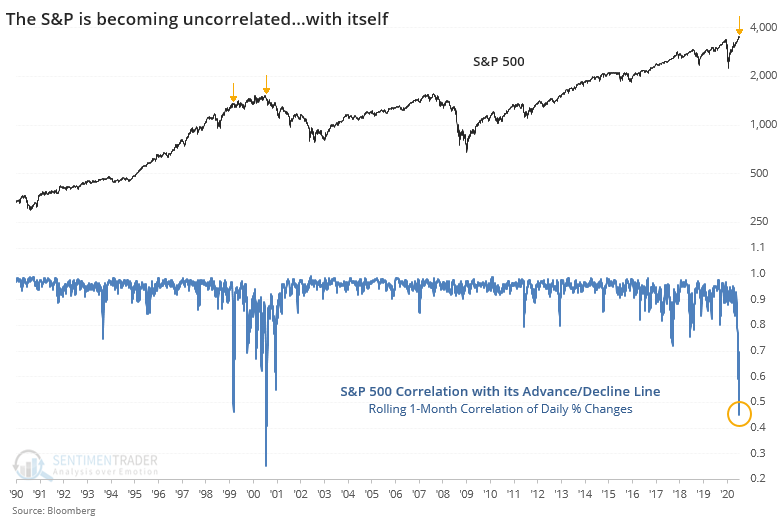
The index is becoming uncorrelated with itself. Isabelnet notes that the correlation between the S&P 500 and its own Cumulative Advance/Decline Line is breaking down. This is a different reflection of the same phenomenon.

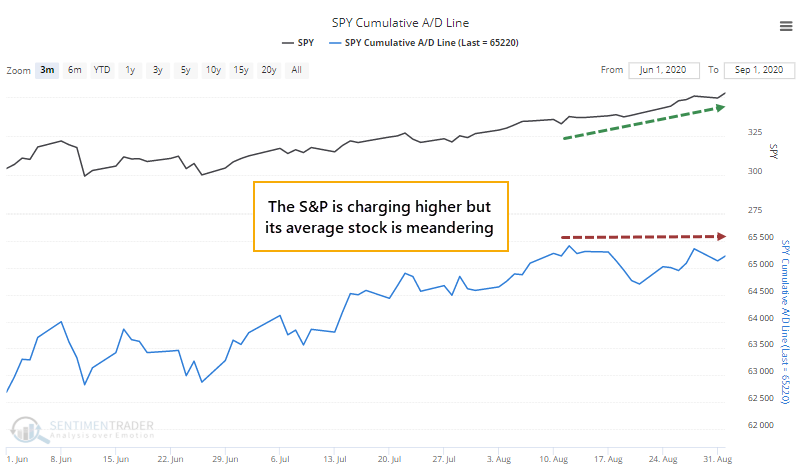
This is nearing the smallest-ever correlation between the index and...itself. The only time there was a smaller correlation was September 2000.

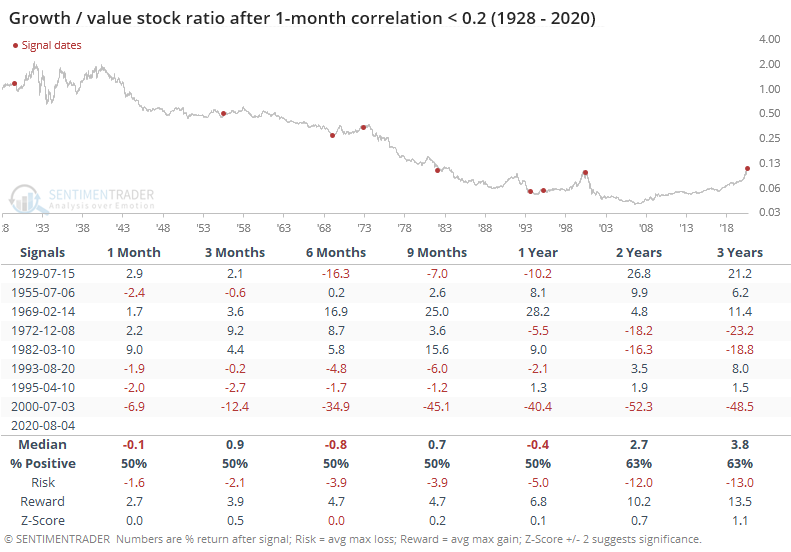
As the Daily Shot notes, this kind of split in the market has also caused a drop in the correlation between value and growth stocks. Going back to 1928, the two factors have never moved quite like this. Over the past month, the two actually have a negative correlation, a stunning historical anomaly.

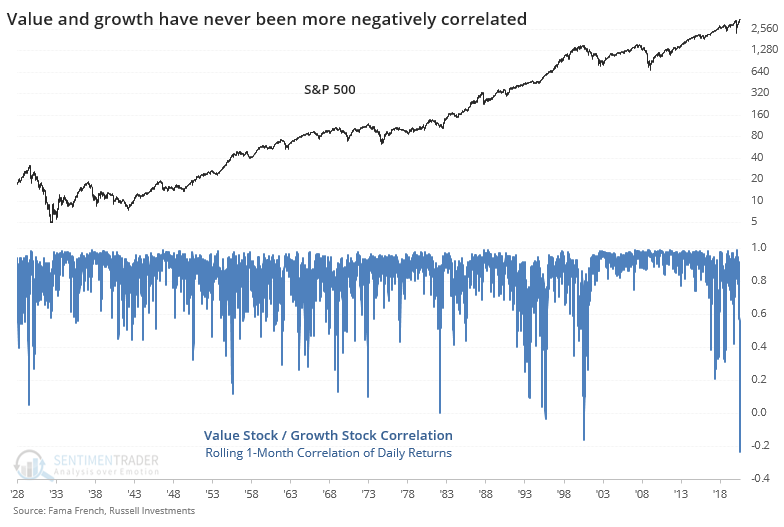
The only other time when the 1-month rolling correlation between daily percentage changes in the two factors dropped close to its current level was, once again, September 2000. That wasn't a great time in history for future returns.

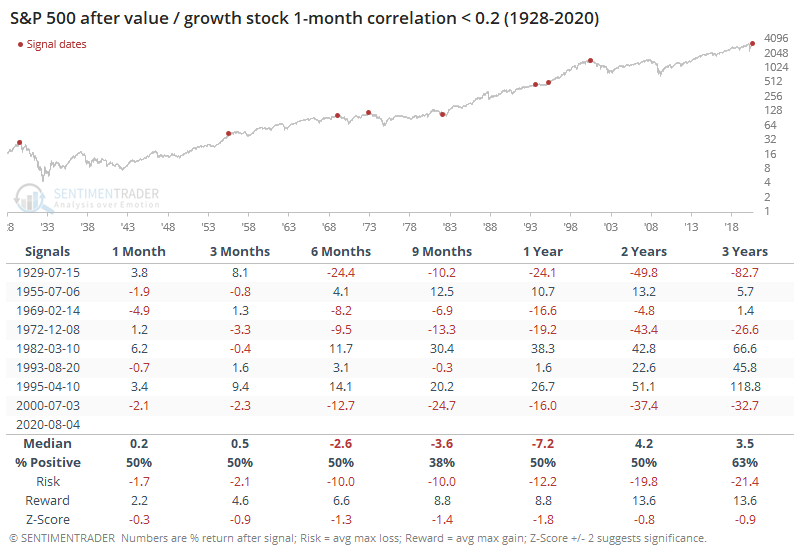
Over the next 9 months, the S&P managed a positive return after 3 out of 8 signals, with a poor average return and risk/reward skew. In 1982 and 1995, there were no ill effects at all, while the others preceded either negative or relatively flat returns over the longer-term.

The ratio between the factors favored value over growth but it wasn't consistent.

This is one of the most unique moments in market history. While "unique" in March/April/May was skewed heavily toward extremely positive cases, "unique" over the past couple of months has indicated flat or lower prices. It hasn't mattered a whit, and maybe that will continue. It would also go against whatever few historical precedents are available.

Sorry, you don't have access to this report

Upgrade your subscription plan to get access
Go to Dasboard
DATA &
TECHnologies
IndicatorEdge
‍
BackTestEdge
‍
Other Tools
‍
DataEdge API
RESEARCH
reports
Research Solution
‍
Reports Library
‍
actionable
Strategies
Trading Strategies
‍
Smart Stock Scanner
‍
FREE
RESOUrCES
Simple Backtest
Calculator
Simple Seasonality
Calculator
The Kelly Criterion
Calculator
Sentiment Geo Map
‍
Public Research Reports
‍
Free Webinar
COMPANY
‍
About
‍
Meet our Team
‍
In the News
‍
Testimonials
‍
Client Success Stories
Pricing
Bundle pricing
‍
Announcements
‍
FAQ
© 2024 Sundial Capital Research Inc. All rights reserved.
Setsail Marketing
TermsPrivacyAffiliate Program
Risk Disclosure: Futures and forex trading contains substantial risk and is not for every investor. An investor could potentially lose all or more than the initial investment. Risk capital is money that can be lost without jeopardizing ones’ financial security or life style. Only risk capital should be used for trading and only those with sufficient risk capital should consider trading. Past performance is not necessarily indicative of future results.

Hypothetical Performance Disclosure: Hypothetical performance results have many inherent limitations, some of which are described below. No representation is being made that any account will or is likely to achieve profits or losses similar to those shown; in fact, there are frequently sharp differences between hypothetical performance results and the actual results subsequently achieved by any particular trading program. One of the limitations of hypothetical performance results is that they are generally prepared with the benefit of hindsight. In addition, hypothetical trading does not involve financial risk, and no hypothetical trading record can completely account for the impact of financial risk of actual trading. for example, the ability to withstand losses or to adhere to a particular trading program in spite of trading losses are material points which can also adversely affect actual trading results. There are numerous other factors related to the markets in general or to the implementation of any specific trading program which cannot be fully accounted for in the preparation of hypothetical performance results and all which can adversely affect trading results.

Testimonial Disclosure: Testimonials appearing on this website may not be representative of other clients or customers and is not a guarantee of future performance or success.