
The S&P 500 is stuck between time frames

We're stuck in post-panic churn, and the most benchmarked index in the world can't seem to get over the hump.
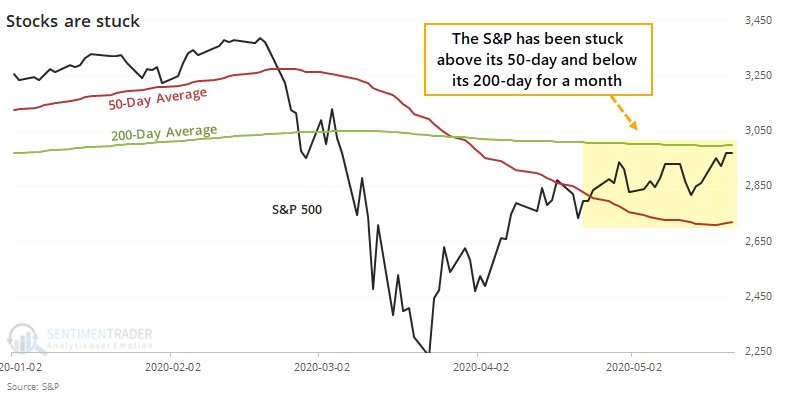
While it could change with a jump in the S&P 500 this week, the index hasn't been able to mount its 200-day average despite approaching it 3 weeks ago. And yet, it's still been able to hold above its rising 50-day average, which caused some to question which time frame will win out.
Now that its streak of being stuck has reached 20 days, it's one of the longer battles between time frames since 1928.
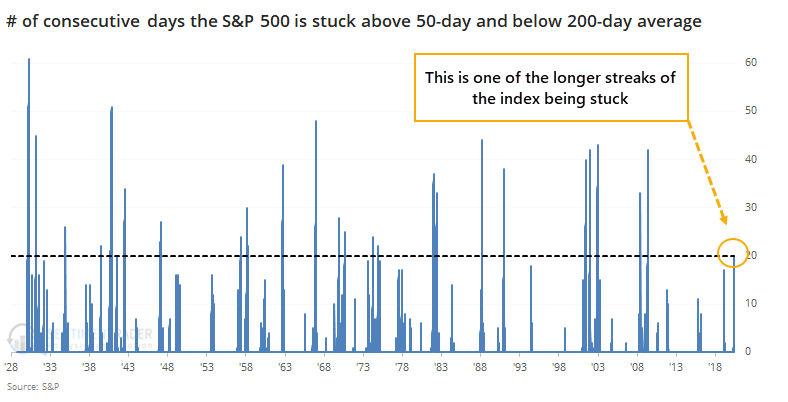
There have been 29 streaks that reached 20 days. Of those, 21 saw the streak end when the S&P fell below its 50-day average. Only 8 ended by the S&P rising above its 200-day average.
It's kind of a no-win situation. If the S&P broke down below its 50-day, then returns were bad (and terrible in recent decades). If it broke out to the upside, then returns were limited across almost all time frames, with really only one exception in 1970. All of the others either saw losses in the month(s) ahead or failed rallies.
The trouble is basically that buyers haven't shown enough oomph to make any progress lately. These are unprecedented times, but a churning, downtrending market has been a big headwind in the past.
This is an abridged version of our recent reports and notes. For immediate access with no obligation, sign up for a 30-day free trial now.
We also looked at:
- Full tables looking at times the S&P 500 is stuck between its 50- and 200-day averages
- Fund outflows have been extreme for overseas (non-U.S.) mutual funds and ETFs
- Options traders continue to bet aggressively on a rally
- Volume in SPY has been cratering
- Crude oil is recovering from its 1-year average