
The S&P 500 is overbought, and several reversal signals triggered an alert

Key points:
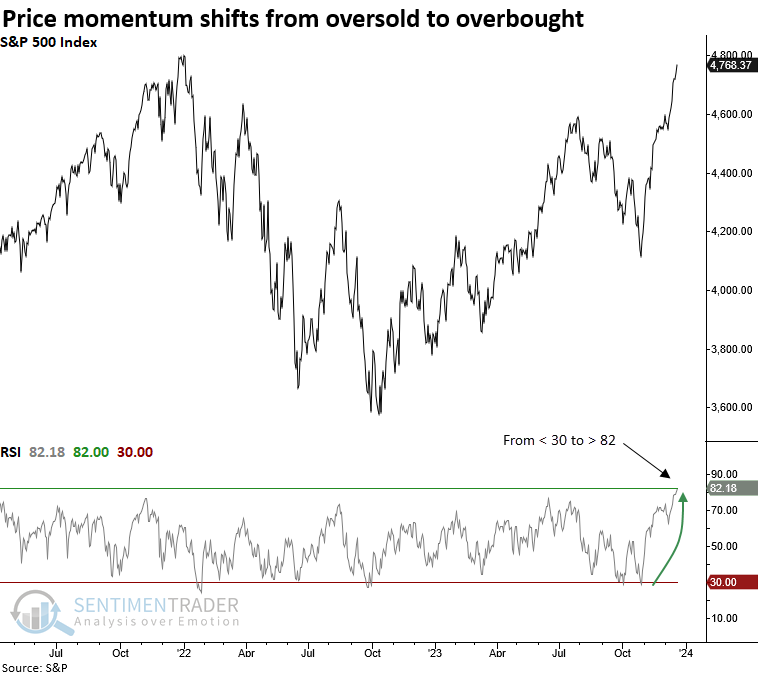
- The Relative Strength Index (RSI) for the S&P 500 rose above 82, indicating an overbought condition
- An outside day occurred from a 1-year high, with the S&P 500 closing in the bottom 10% of its range
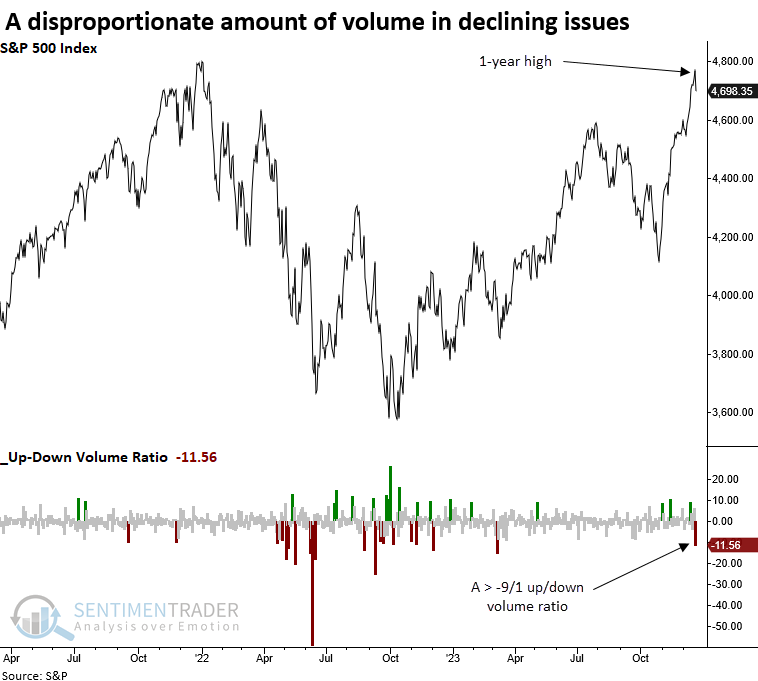
- The NYSE up/down volume ratio exceeded -9/1 the day after the S&P 500 closed at a 1-year high
- While these conditions/patterns might look scary on the surface, they rarely mark the end of a trend
What should we make of an overbought condition and reversal patterns
Our primary goal is to share evidence-based research that provides a market edge. However, we sometimes publish studies to debunk myths propagated by self-proclaimed experts on TV or Twitter who make unfounded remarks about the latest market trends.
Over the past few days, the gurus have been vocal about the Relative Strength Index (RSI) surging into an extremely overbought status, the ominous outside day reversal bar, or the staggering increase in downside volume.
Of course, none of the click-bate comments provide supporting evidence. With that in mind, let's dispel the myths.
I use the standard 14-day RSI setting.
Similar Relative Strength Index (RSI) conditions suggest a short-term pause
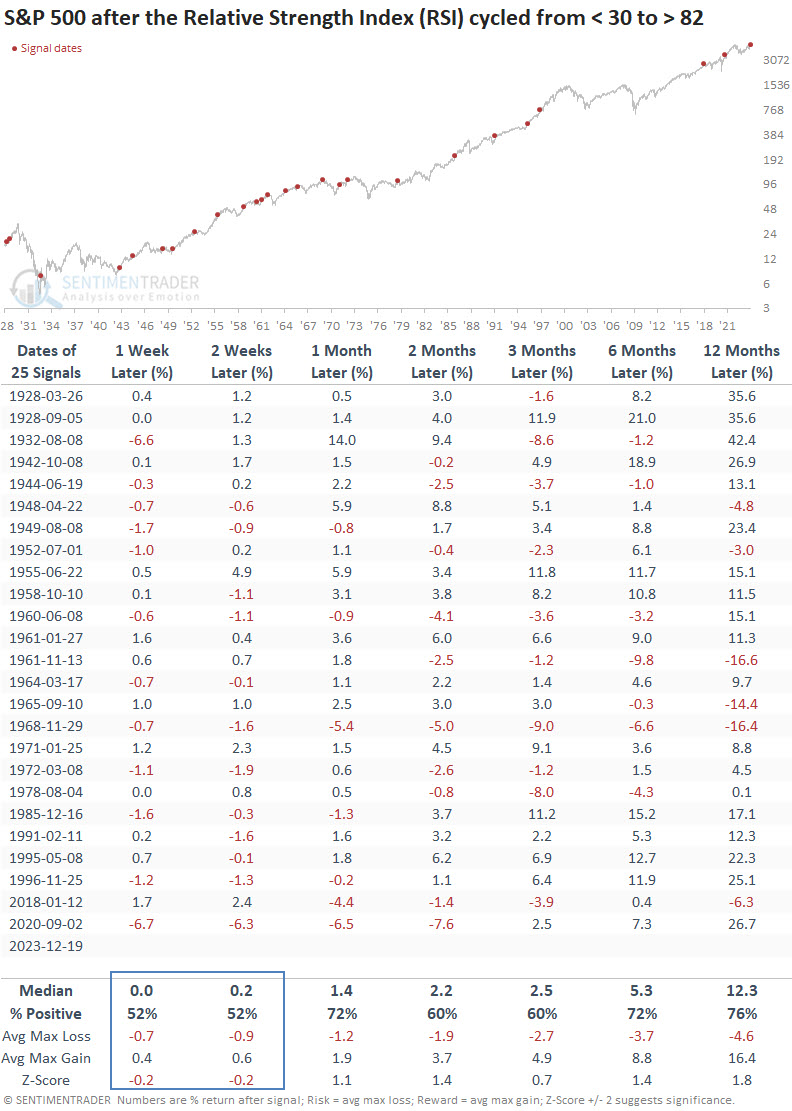
Whenever the Relative Strength Index (RSI) for the S&P 500 cycled from less than 30 to greater than 82, history suggests the large-cap index may experience a brief slowdown in the following weeks. However, the pause tends to refresh the uptrend, with the world's most benchmarked index rising consistently from one to twelve months later.
Up/Down Volume Ratio
The NYSE suffered its first greater than -9/1 up/down volume ratio reading since March. However, this precedent occurred one day after the S&P 500 closed at a 1-year high, an event rarely seen since 1950.
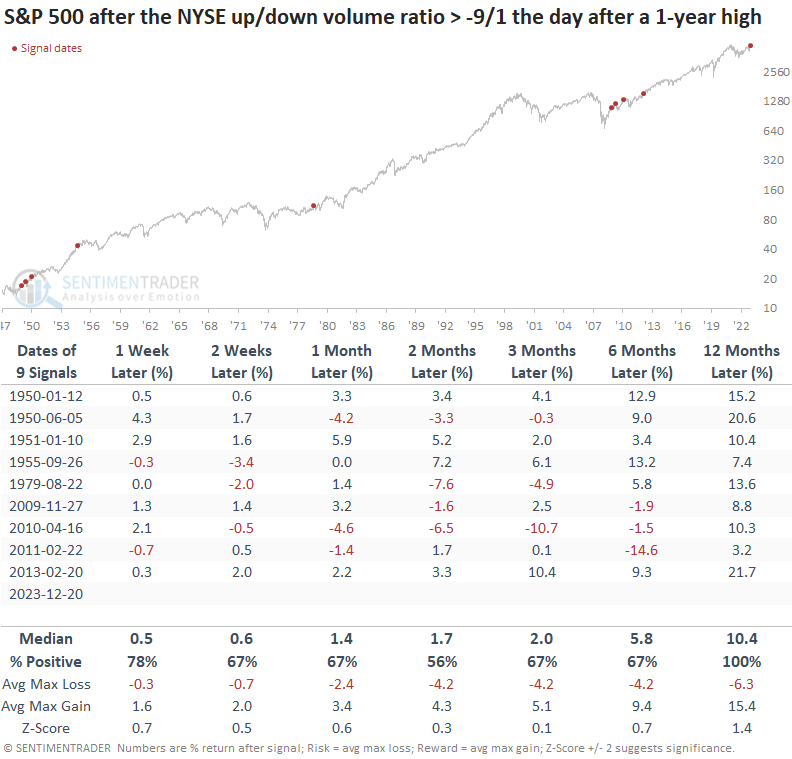
While the sample size is small, the S&P 500 tended to bounce back after similar one-day volume skews after a 1-year high. Over the subsequent month, the S&P 500 showed a gain at some point in every instance, albeit one precedent was minimal. A year later, the world's most benchmarked index was higher 100% of the time. However, 2010 and 2011 exhibited greater than -10 % drawdowns before reaching positive returns.
A Reversal Pattern
The S&P 500 reversed lower on Wednesday, triggering an outside day. This pattern emerges when the current bar registers a high greater than the previous day's high, accompanied by a low that is less than the low of the prior session.
While the outside day pattern does not consider where the close occurred relative to the daily range, the S&P 500 closed near the absolute low on Wednesday.
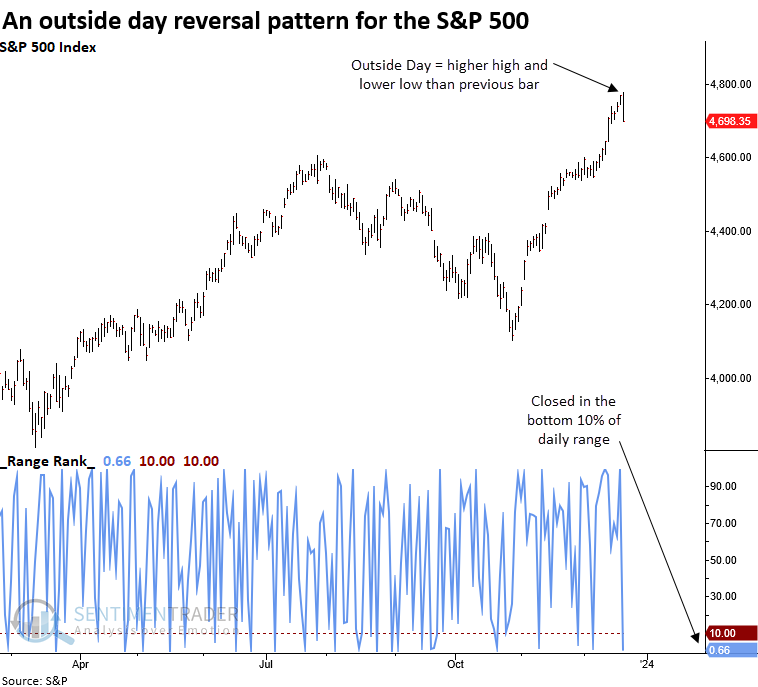
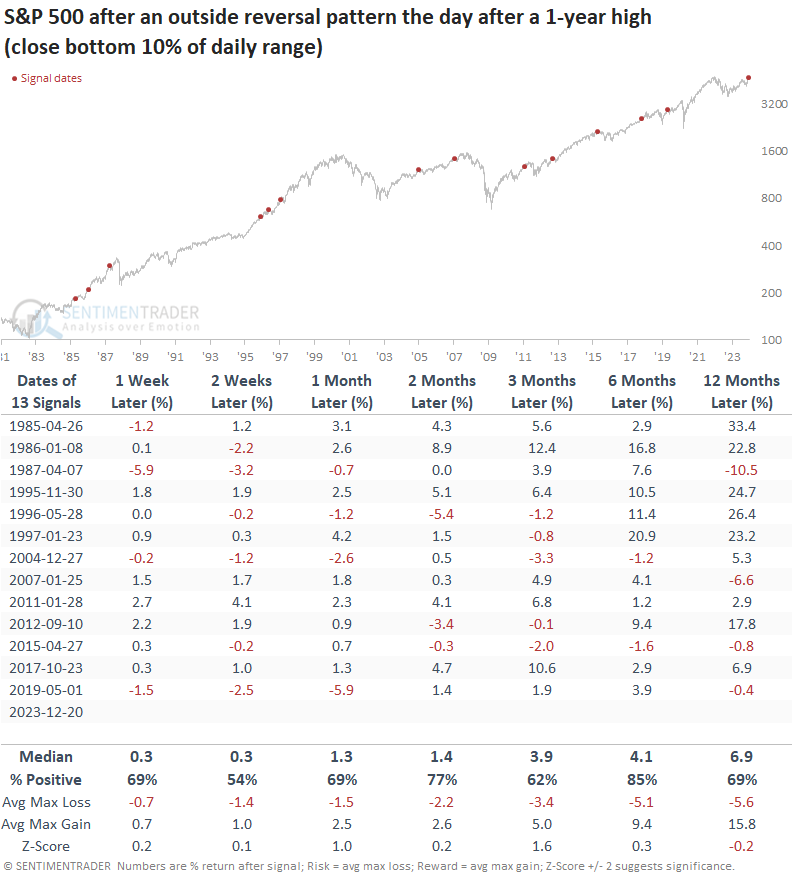
When an outside day pattern occurs with the S&P 500 closing in the bottom 10% of its daily range, the one-day pattern tends to be a non-event. A week later, the large-cap index was higher 69% of the time, and six months later, it was up 85% of the time.
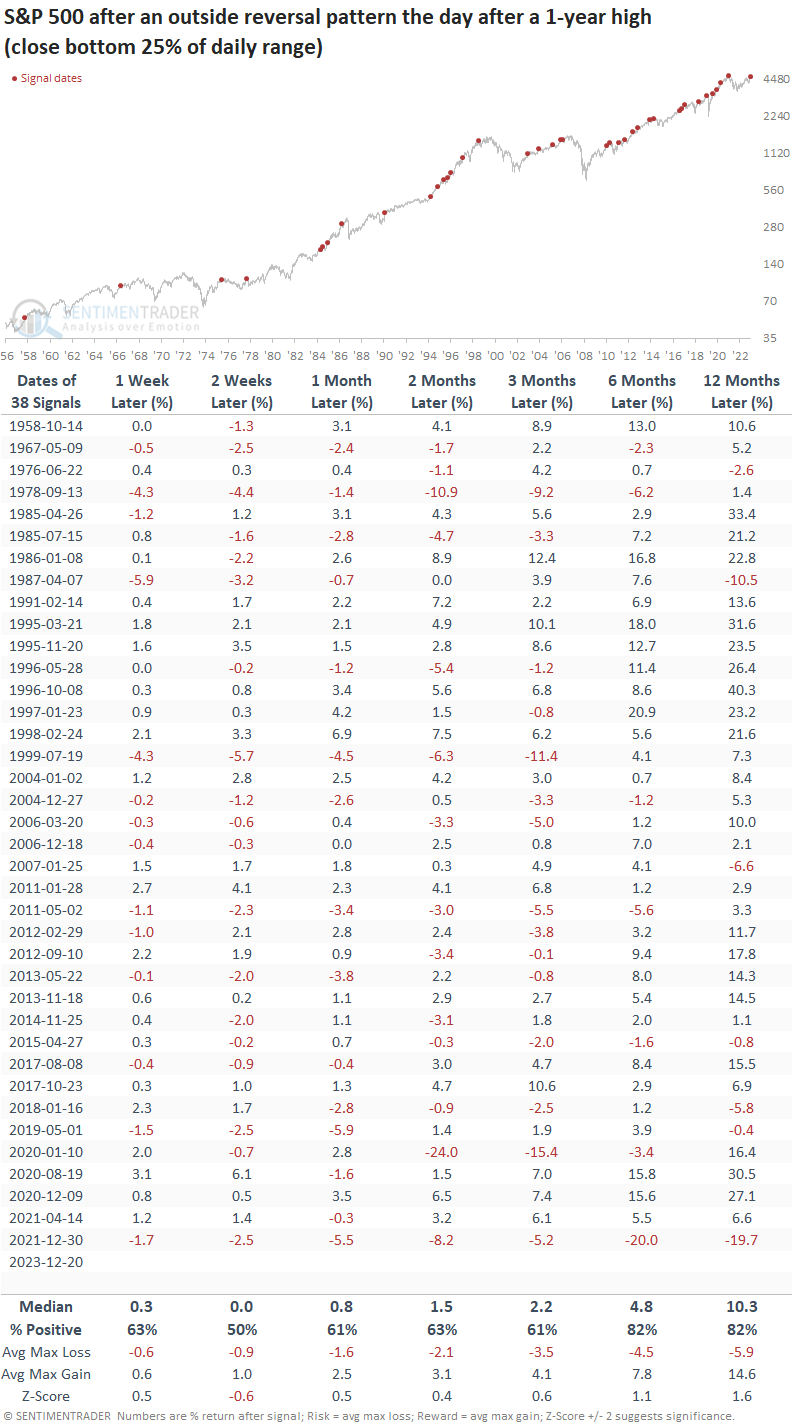
Suppose I adjust the range condition from the bottom 10% to the bottom 25% to capture more precedents. In that case, you get a coin toss win rate over the following two weeks with a return below the study period average.
Six and twelve months later, the S&P 500 was higher 82% of the time.
What the research tells us...
With the S&P 500 and various other indexes enjoying a robust year-to-date gain and an exceptionally impressive six-week rally, it is no surprise that traders are adopting a "shoot first, ask questions later" approach to safeguarding their profits as we approach the last few days of trading in 2023. While the overbought condition and reversal signals may instill a sense of caution, history suggests this will likely be a temporary deviation rather than a definitive shift in the bullish backdrop.