Products
SentimenTrader Trading Tools
‍
Backtest Engine
My Trading Toolkit
Correlation Analysis
Seasonality
Market Prediction
Indicators & Data API
‍
Proprietary Indicators & Charts
Market Data API
Strategies & Scanner
‍
50+ Trading Strategies
Smart Stock Scanner
Smart Option Scanner
Research Reports
‍
Research Solutions
Reports Library
Free Resources
Simple Backtest Calculator
Simple Seasonality Calculator
The Kelly Criterion Calculator
Sentiment Geo Map
Public Research Reports
Education
Sentiment Indicators
Technical Indicators
Pricing
Company
About
In the News
Testimonials
Client Success Stories
Contact
Log inLoginSign up
< BACK TO ALL REPORTS

The S&P 500 formed a rare reversal and gap-down pattern

Dean Christians
2025-02-03
Over the past two sessions, the S&P 500 formed a rare reversal and gap-down pattern. Comparable precedents saw the world's most benchmarked index struggle in the subsequent few weeks before rebounding, with the index posting a gain 100% of the time two months later.

Key points:

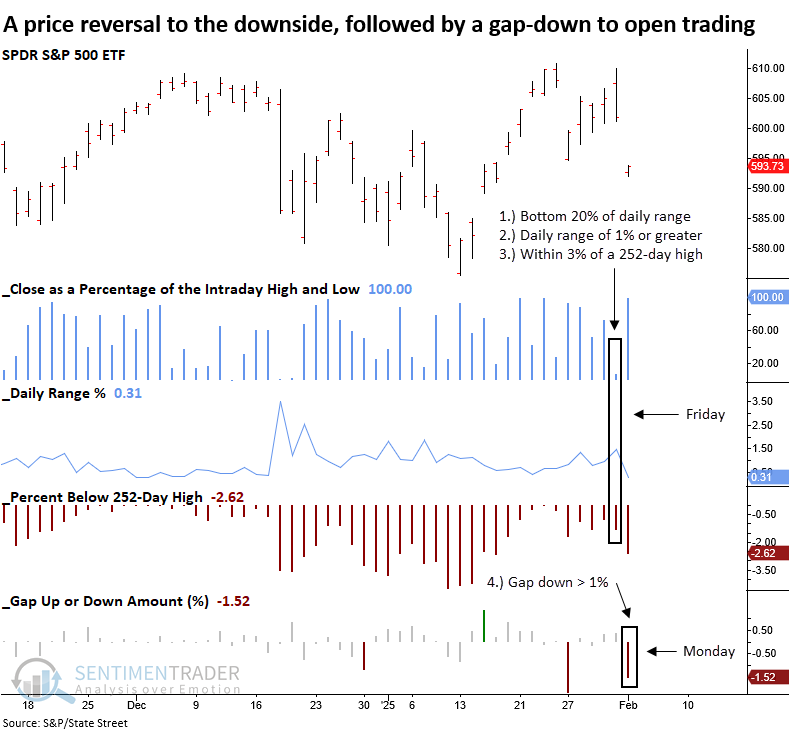
  • The S&P 500 reversed lower on Friday and gapped down over 1% at the open of trading today
  • Similar price patterns suggest that the large-cap index could face short-term headwinds before rebounding

Does the S&P 500's price pattern signal trouble, or is it just noise within a bullish trend? 

Last Friday, the stock market turned lower upon reports that the U.S. would impose tariffs on Canada, Mexico, and China. Confirmation over the weekend led to a signficant downside gap to open trading on Monday, sending traders into a frenzy.

Although this two-day price pattern, illustrated in the chart below, may seem alarming, it's crucial to remain objective. Throughout history, headlines have always fueled a sell first, ask questions later mentality from traders. 

Successful investing, however, requires resisting emotional decision-making. 

The S&P 500 ETF (SPY) was used for this study instead of the cash S&P 500 index, as it reflects price gaps-something the cash index cannot capture. While this results in fewer historical precedents, it provides the most comparable context to recent market conditions. 

Comparable price patterns suggest stocks struggle in the next few weeks

Although the sample size is tiny, whenever a downside price pattern reversal was followed by a next-day gap-down of 1% or more, the S&P 500 struggled in the weeks ahead, with the most significant risk of further downside typically unfolding in the first week.

Once the shakeout concluded, the index rebounded, posting gains 100% of the time over the next two and three months. 

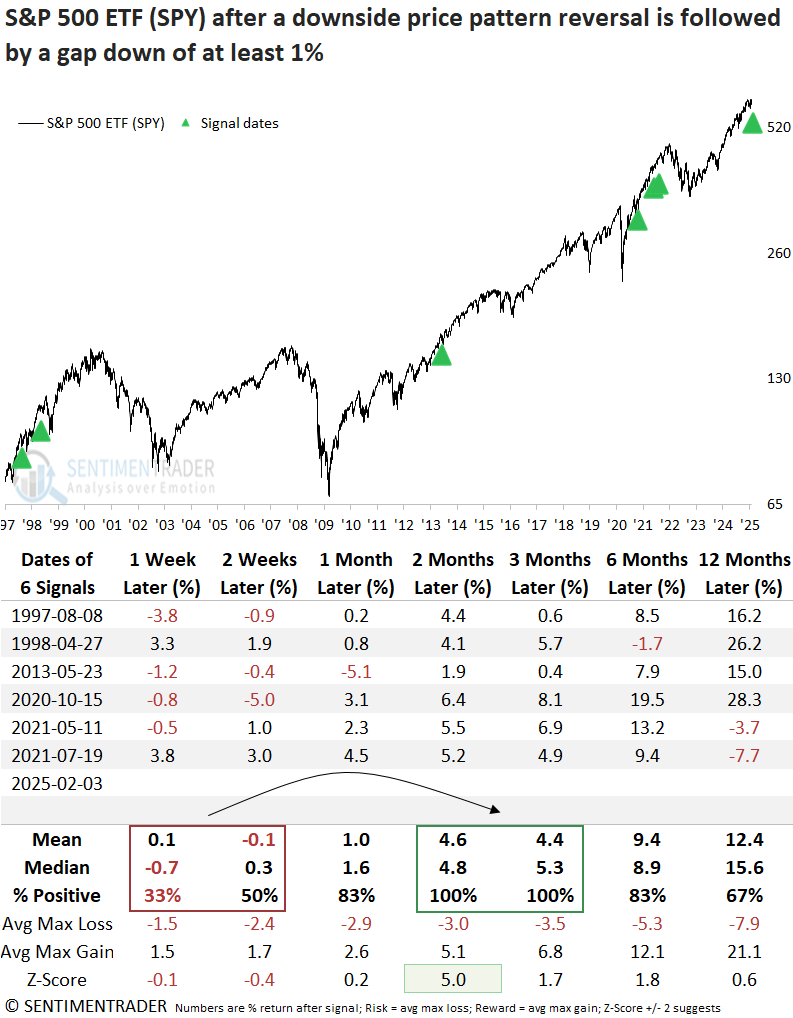
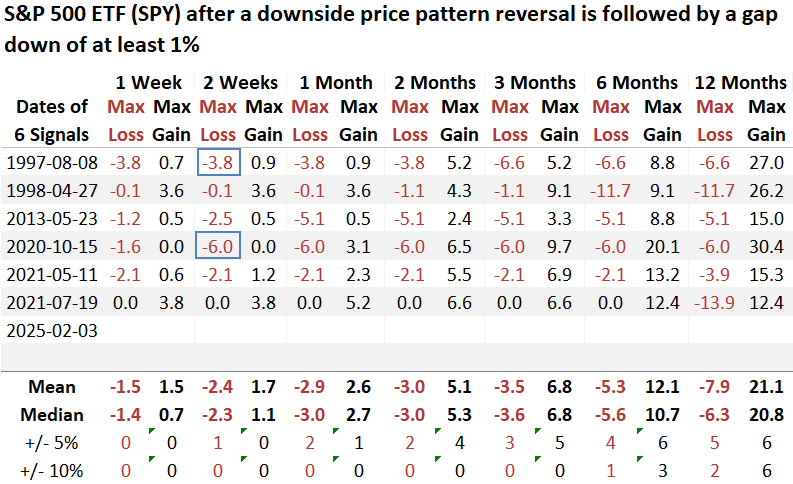
The risk/reward profile moves from unfavorable in the first month to favorable in the second, with a maximum loss not exceeding 6%. 

What the research tells us...

Short-term price patterns, like those observed over the past two sessions, often appear ominous at first glance, fueling bearish narratives. Yet, history suggests these setups rarely play out as the crowd expects, as they typically occur following a headline that surprises market participants. Once cooler heads prevail, the prior trend often resumes, leading to higher stock prices after a consolidation phase. Even if this time is different and tariffs prove disruptive, investors will likely have time to adjust portfolios, as significant market tops tend to develop gradually.

PRODUCTS
SentimenTrader
Trading Tools
Indicators & Data API
‍
Strategies & Scanner
‍
Research Reports
FREE
RESOUrCES
Simple Backtest
Calculator
Simple Seasonality
Calculator
The Kelly Criterion
Calculator
Sentiment Geo Map
‍
Public Research Reports
‍
Education
Sentiment Indicators
‍
Technical Indicators
‍
Pricing
Bundle pricing
‍
FAQ
‍
Announcements
‍
COMPANY
‍
About
‍
In the News
‍
Testimonials
‍
Client Success Stories
CONTACT
‍
General Inquiries
‍
Media Inquiries
‍
Financial Professionals Inquiries
‍
© 2026 Sundial Capital Research Inc. All rights reserved.
Setsail Marketing
TermsPrivacyAffiliate Program
Risk Disclosure: The information and tools provided are for research and analytical purposes only and are not intended as investment advice. Market analysis involves uncertainty, and outcomes may differ from expectations. Users should conduct their own due diligence and consider their individual circumstances before making any financial decisions. Past performance is not necessarily indicative of future results.

Hypothetical Performance Disclosure: Hypothetical performance results have many inherent limitations, some of which are described below. No representation is being made that any account will or is likely to achieve profits or losses similar to those shown; in fact, there are frequently sharp differences between hypothetical performance results and the actual results subsequently achieved by any particular trading program. One of the limitations of hypothetical performance results is that they are generally prepared with the benefit of hindsight. In addition, hypothetical trading does not involve financial risk, and no hypothetical trading record can completely account for the impact of financial risk of actual trading. for example, the ability to withstand losses or to adhere to a particular trading program in spite of trading losses are material points which can also adversely affect actual trading results. There are numerous other factors related to the markets in general or to the implementation of any specific trading program which cannot be fully accounted for in the preparation of hypothetical performance results and all which can adversely affect trading results.

Testimonial Disclosure: Testimonials appearing on this website may not be representative of other clients or customers and is not a guarantee of future performance or success.