
The S&P 500 Finally Cracks its 50-Day Average as NYSE Securities Weaken Further

We've looked at a lot of momentum and breadth studies in recent months, with the conclusion that 2021 has been a year for the record books. The few precedents often witnessed some short-term soft spots but consistently good longer-term returns.
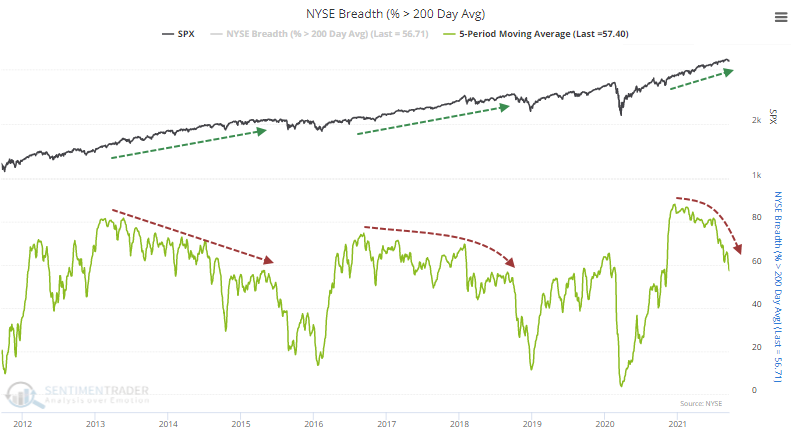
Broader market breadth has been weakening for months, but major indexes shrugged that off with ease. Among stocks traded on the NYSE, fewer and fewer have been holding above their 200-day moving averages. That happened in 2014 and 2017 as well, but it persisted for a very long time.
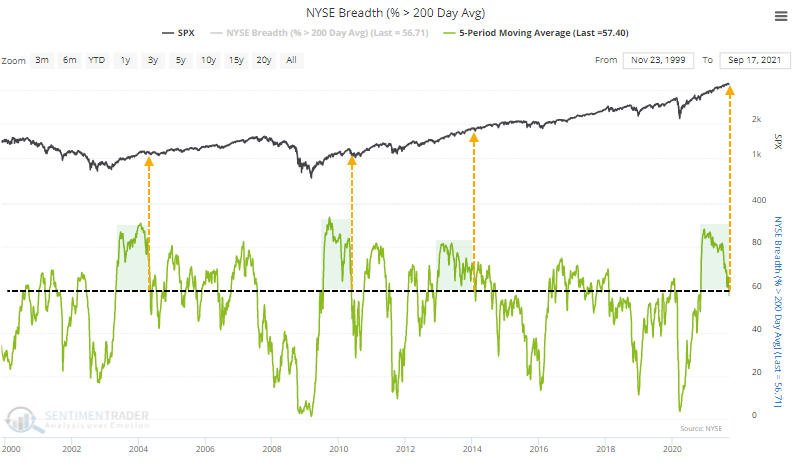
The 5-day average of this figure dropped below 60% for the first time in over 200 sessions. The only other streaks like this in the past 25 years occurred in 2004 and 2010 following the initial recoveries after bear markets, and in 2014 following the remarkable momentum market of 2013.
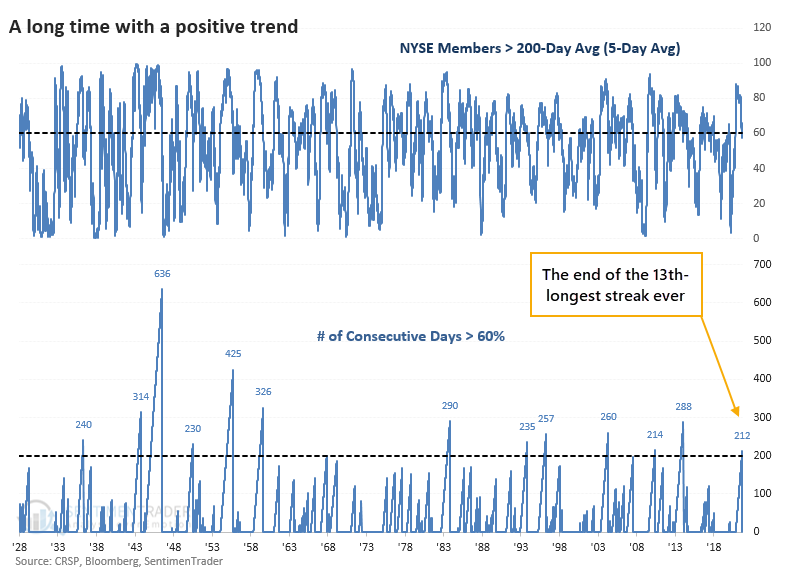
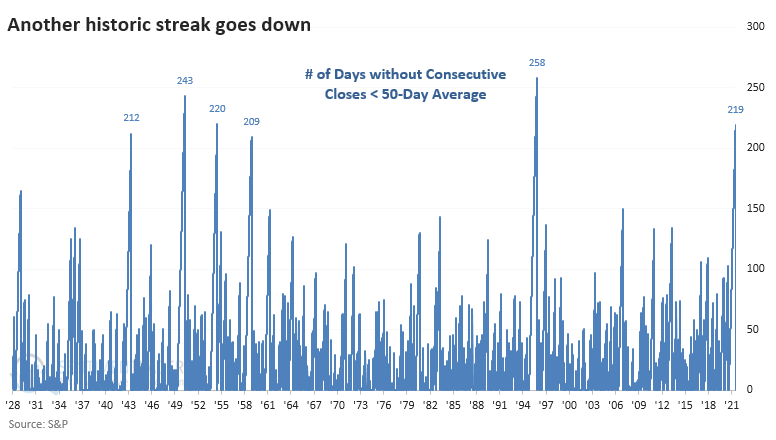
Going back to 1928, last week ended the 13th-longest streak since 1928.
FEW MAJOR DECLINES
Like we've seen with most of the other studies that looked at long-term momentum and positive breadth, the ends of streaks like this typically did not morph into something more serious. Out of the 12 precedents, only one preceded a double-digit decline over any time frame.
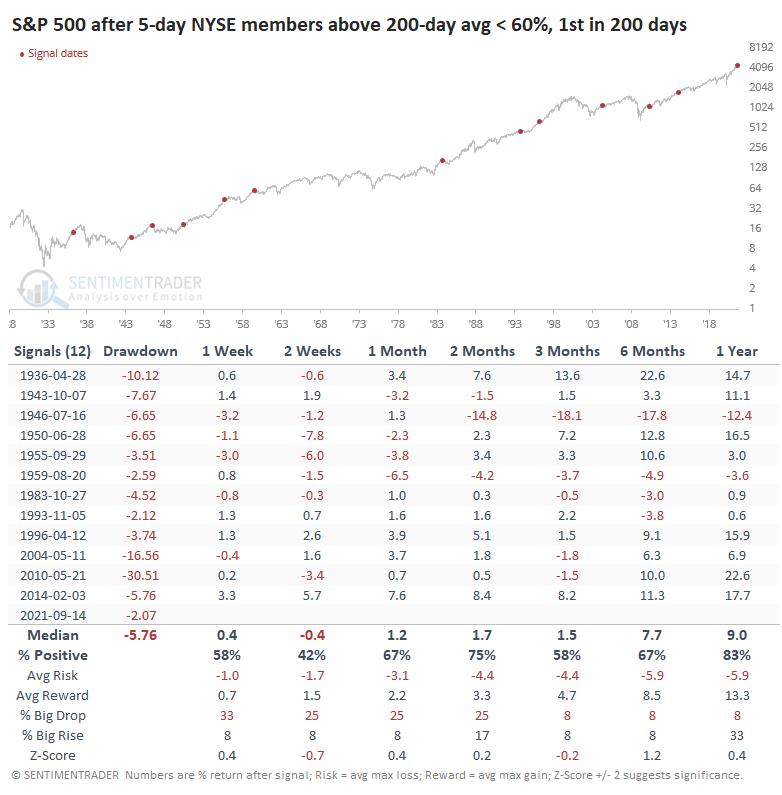
When the other long streaks ended, the S&P 500 was an average of 5.8% below a multi-year high at the time (the "Drawdown" column in the above table). When the streak ended last week, the S&P was only 2.1% from its peak, the shallowest pullback of all.
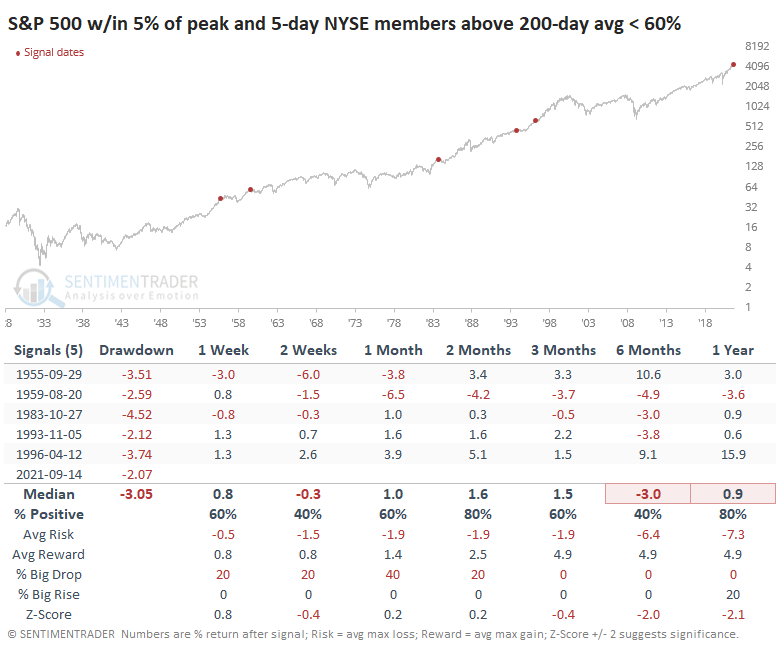
The others saw some back-and-forth trading activity in the weeks ahead but with primarily positive resolutions. With such a tiny sample size, it's hard to draw any solid conclusions, but again, none of them augured bear markets or even corrections.
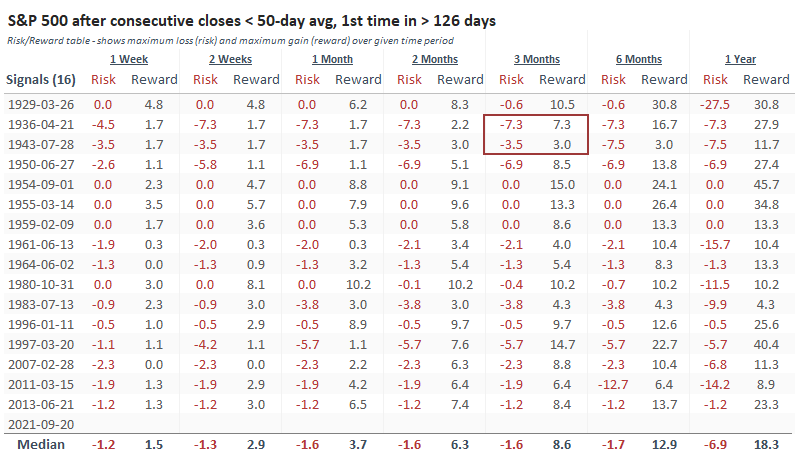
BACK-TO-BACK CLOSES BELOW THE 50-DAY
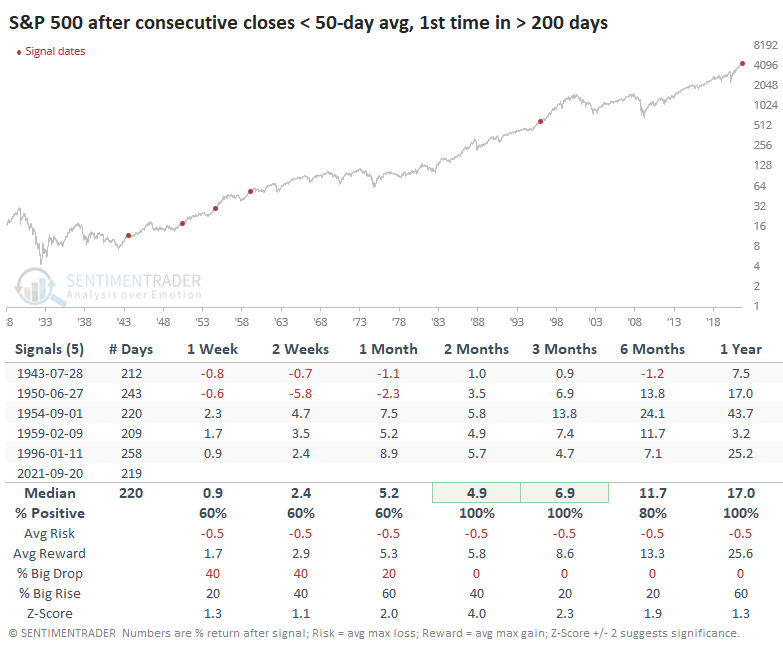
While many securities have been pulling back, indexes like the S&P 500 have held firm. But barring a remarkable turnaround, today will mark the S&P's first back-to-back closes below its 50-day moving average in over 200 sessions. That ends the 4th-longest streak since 1928.
The ends of the other longer streaks showed that the dip was just that - a temporary dip.
Even if we relax the parameters to look at "only" six months without consecutive closes below the 50-day, the S&P showed no losses over the next 2-3 months.
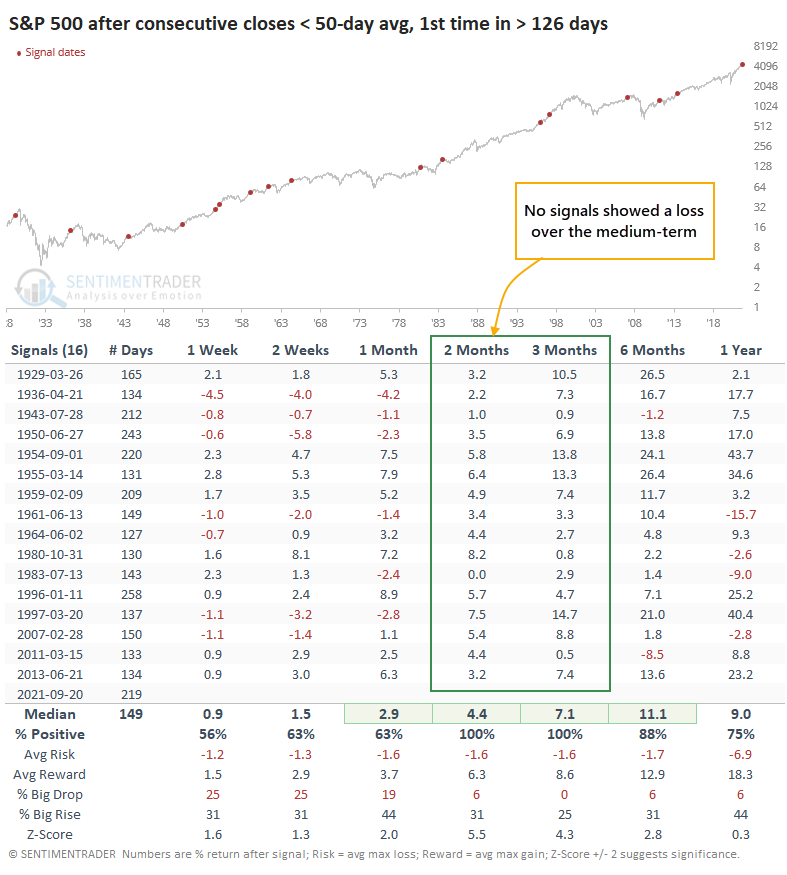
The Risk/Reward Table shows that 14 out of 16 signals offered more reward (maximum gain) than risk (maximum decline) over the next three months, and both of those losers were *just barely*.
The deterioration in breadth in recent months has contributed to a sense of unease. Still, some of those conditions were evident earlier in the year and resolved to the upside. Now that we finally see some cracks in the more widely-followed indexes, it seems to be weighing on sentiment more than some of the obscure declines did.
That raises the risks in the short-term, but we've seen time and again that the ends of vast gobs of momentum and positive trends rarely, if ever, precede significant and sustained declines. That would support the idea that whatever selling pressure hits now and in the coming weeks, for whatever fundamental reason given as an excuse, will be met with latent buying interest as investors sense their first potential bargains in a year.