
The S&P 500 closed above its 50-day average in a long-term downtrend

Key points:
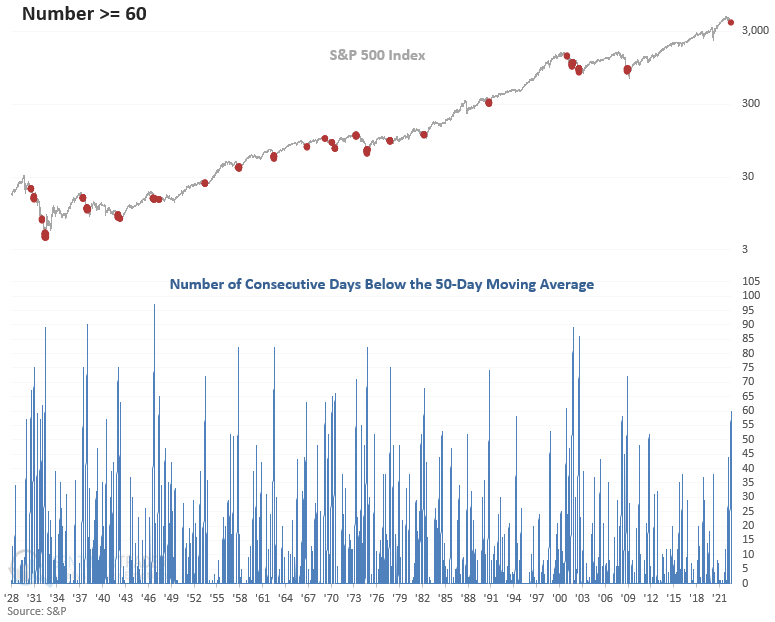
- The S&P 500 closed above its 50-day moving average on Tuesday
- Before the medium-term trend change, the index had closed below the average for 60 sessions
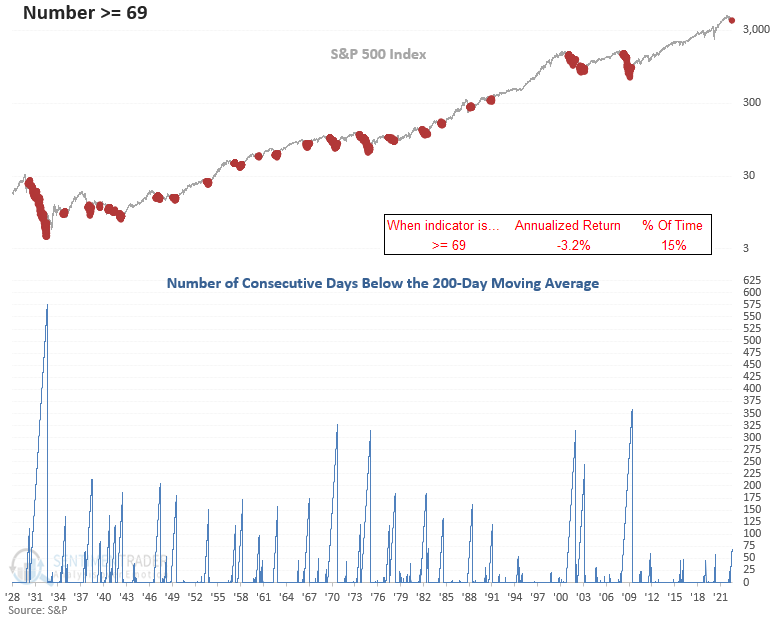
- The index remains below its 200-day moving average, with a count of 69 sessions
- Similar conditions preceded flat to negative returns for stocks across short and medium-term time frames
A medium-term trend change that is not so friendly
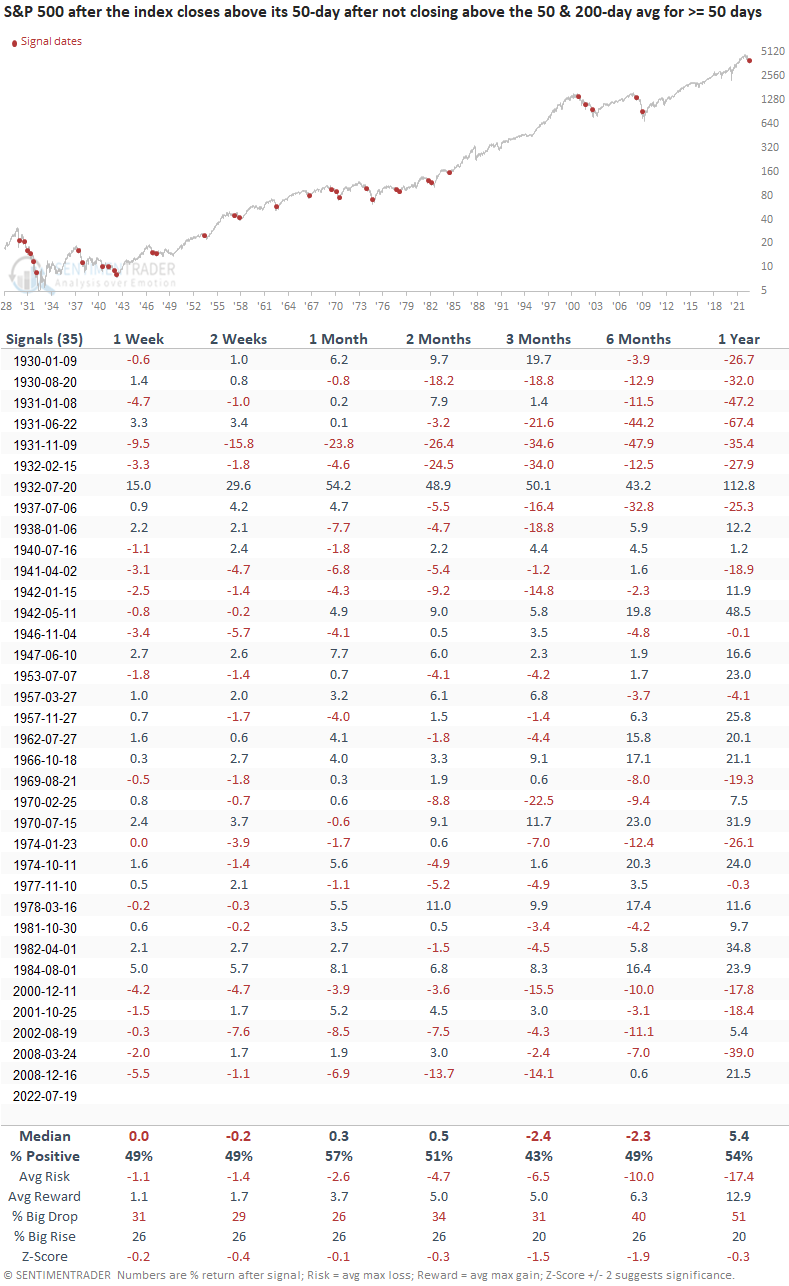
Let's conduct a study to assess the outlook for the S&P 500 when the index closes above its 50-day moving average for the first time in more than 50 sessions. At the same time, the index must be trading below its 200-day moving average for 50 days or longer.
For the 1st time since the global financial crisis, the S&P 500 traded below its 50-day average for 60 consecutive sessions.
Annualized returns are unfavorable when the S&P 500 trades below its 200-day moving average for 69 days or longer.
Similar medium-term trend changes preceded flat to negative returns
This study generated a signal 35 other times over the past 92 years. After the others, S&P 500 returns, win rates, and z-scores were unfavorable across most short and medium-term time frames, especially the 3 & 6-month windows. The signal had a negative return at some point in the first 2 months in 30 out of 35 instances.
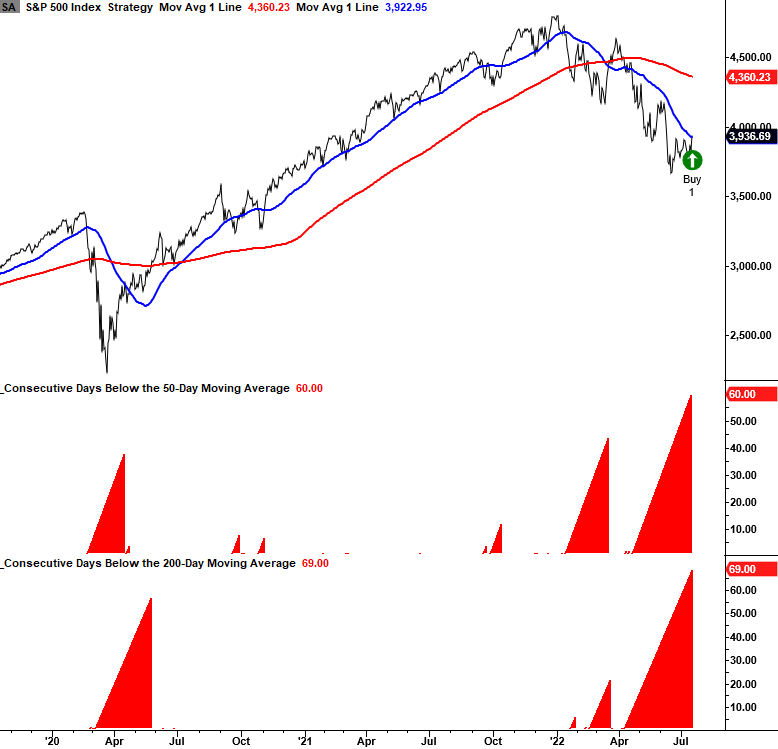
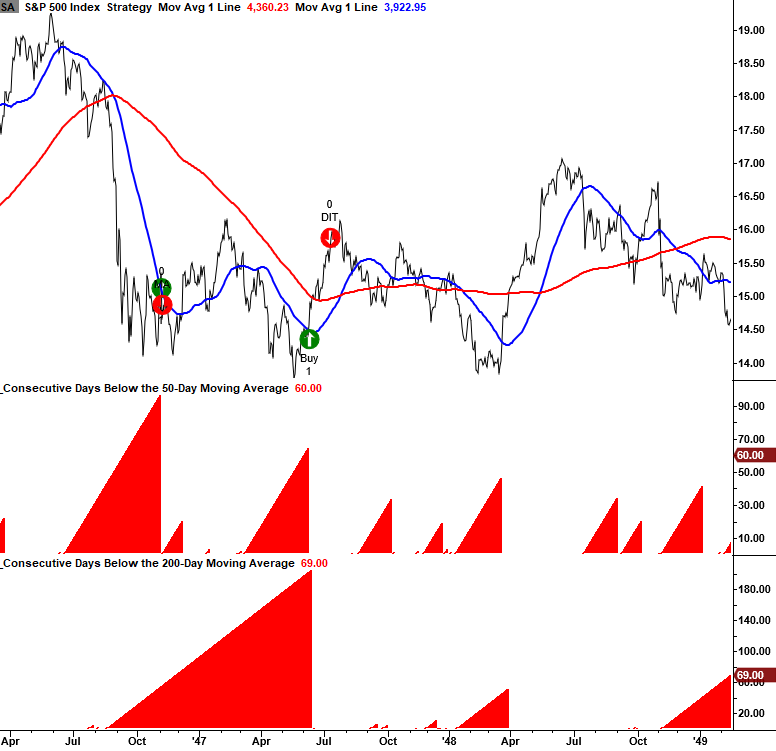
Let's zoom in and review some of the signals/charts since 1946. If you notice that the red arrows say MA or DIT, it's because I created two exit signals. The MA text means the S&P 500 closed below the 50-day average before a 21-day holding period expired. Suppose the text says DIT. In that case, the index traded above the moving average for 21 days. If you were wondering, the S&P 500 closed below the 50-day average 68% of the time before the 21 holding period expired.
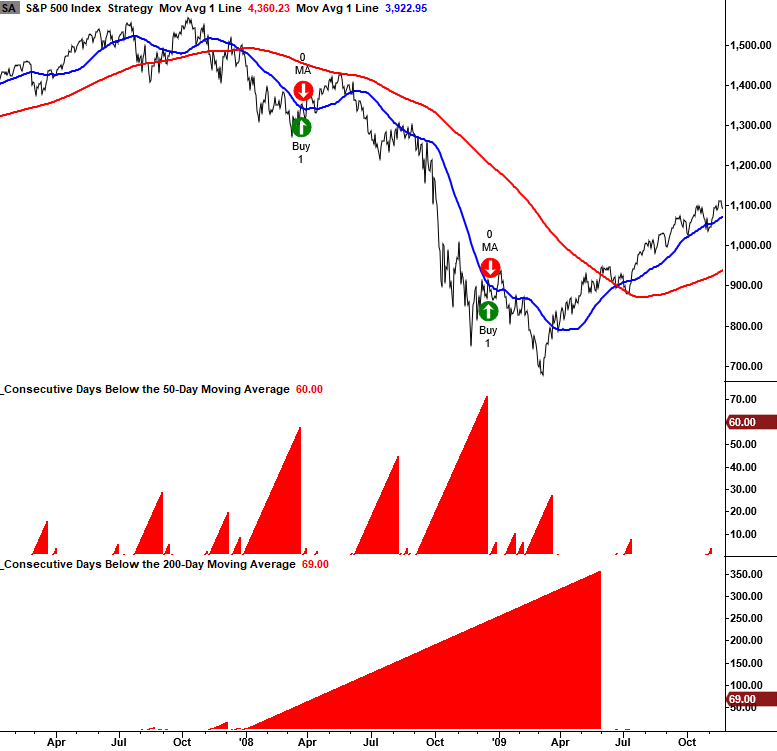
Current day chart example
2007-08 chart example
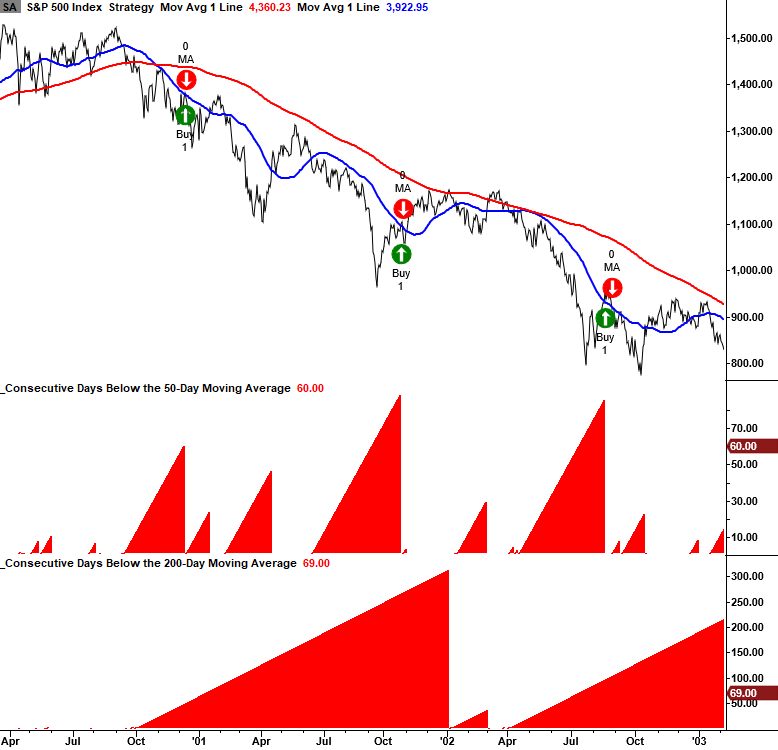
2000-02 chart example
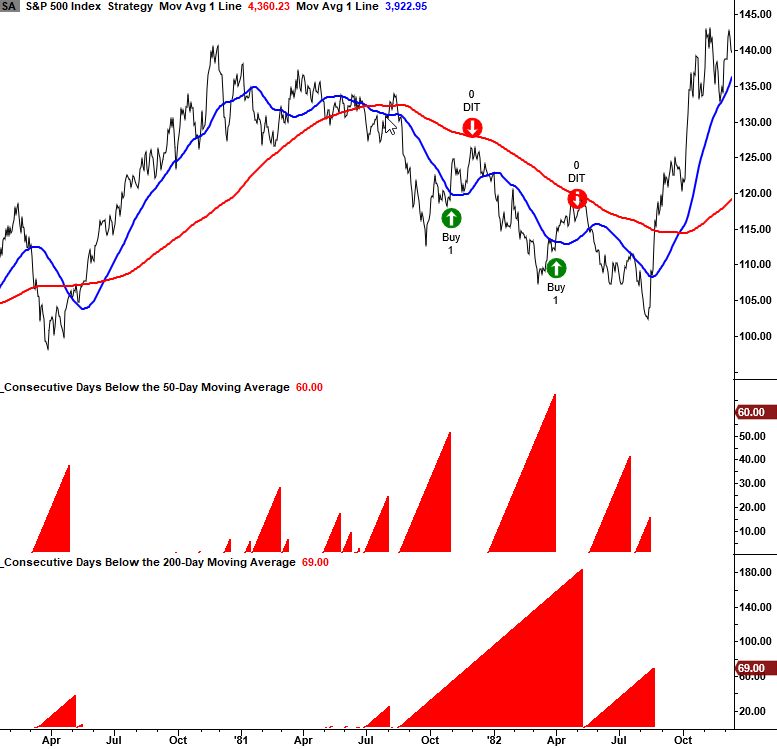
1980-82 chart example
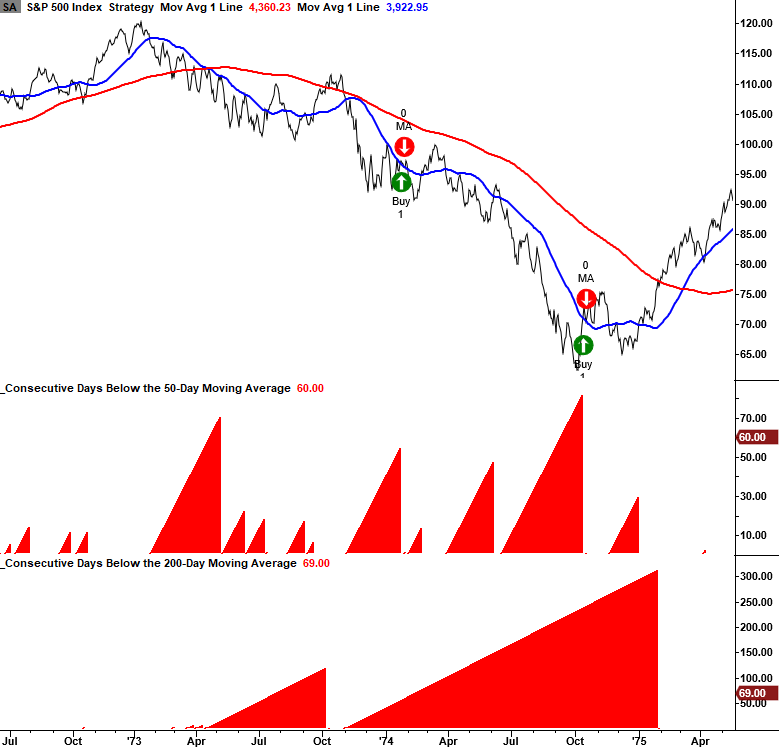
1973-74 chart example
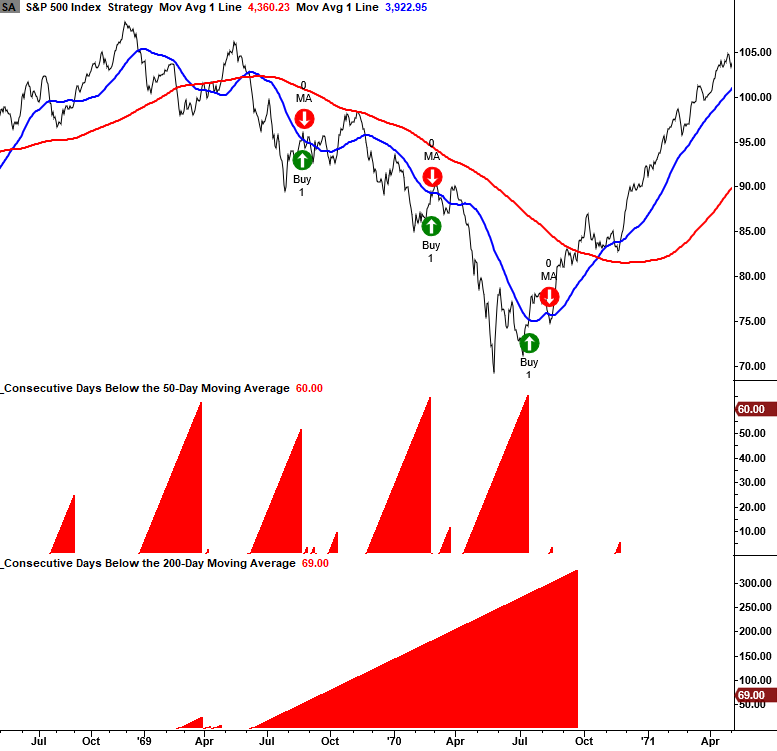
1968-70 chart example
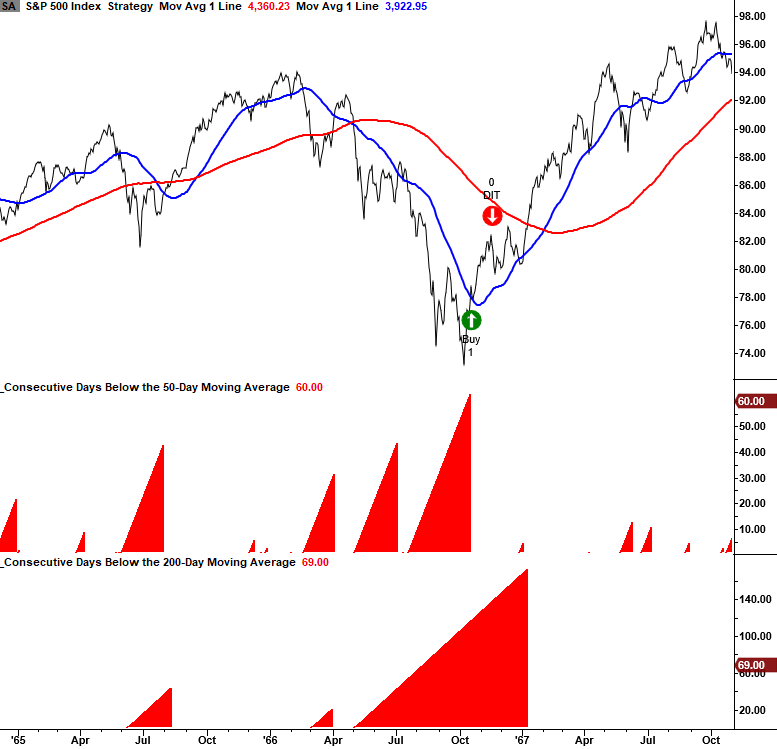
1966 chart example
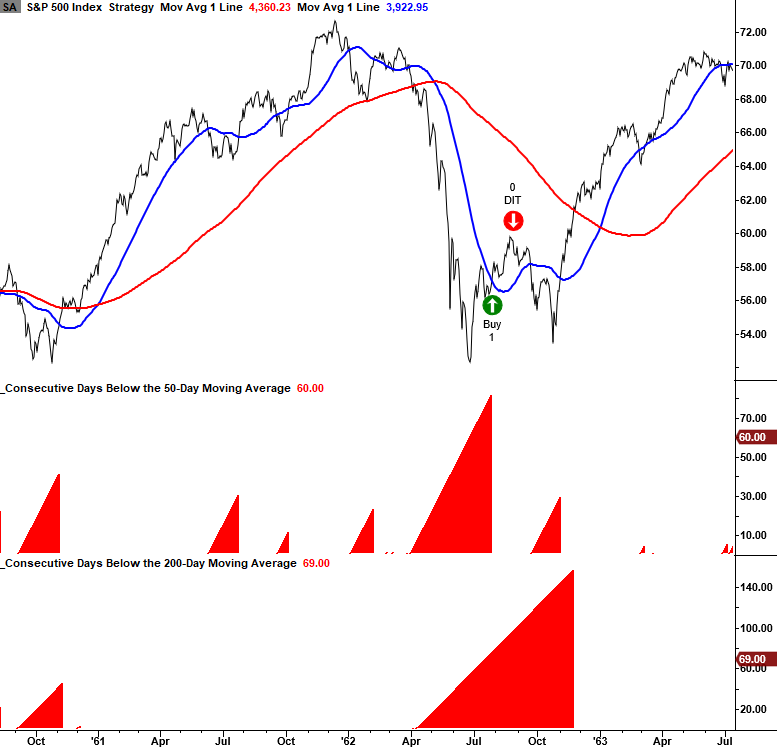
1962 chart example
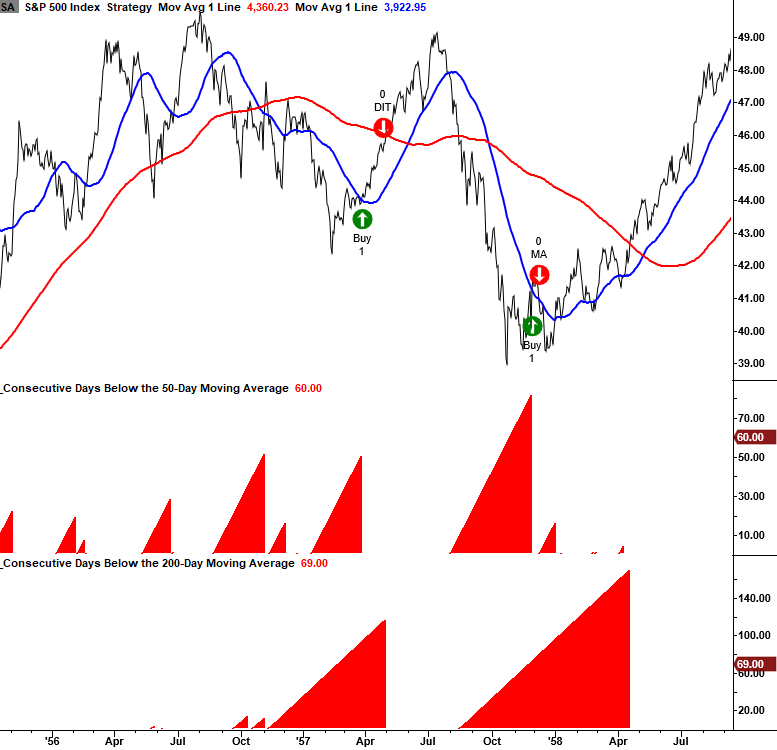
1957-58 chart example
1946-49 chart example
What the research tells us...
When the S&P 500 closes above its 50-day moving average for the first time in 50 sessions or more and the index is in a well-established long-term downtrend, we need to remember that the trend is not our friend. Similar setups to what we're seeing now have preceded flat to negative stock returns across short and medium-term time frames.