Data &
Technology
Research
Reports
Report Solutions
Reports Library
Actionable
Strategies
Free
Resources
Simple Backtest Calculator
Simple Seasonality Calculator
The Kelly Criterion Calculator
Sentiment Geo Map
Public Research Reports
Free Webinar
Pricing
Company
About
Meet Our Team
In the News
Testimonials
Client Success Stories
Contact
Log inLoginSign up
< BACK TO ALL REPORTS

The S&P 500 and dollar undergo trend changes

Jason Goepfert
2020-07-09
The S&P 500 has triggered a Golden Cross, with its 50-day average crossing above its 200-day average. That in itself isn't much of a signal, but this has reversed what had been a very negative spread between the 50- and 200-day averages. When this happened since 1950, it coincided with the end of every major bear market. At the same time, the dollar suffered a Death Cross.

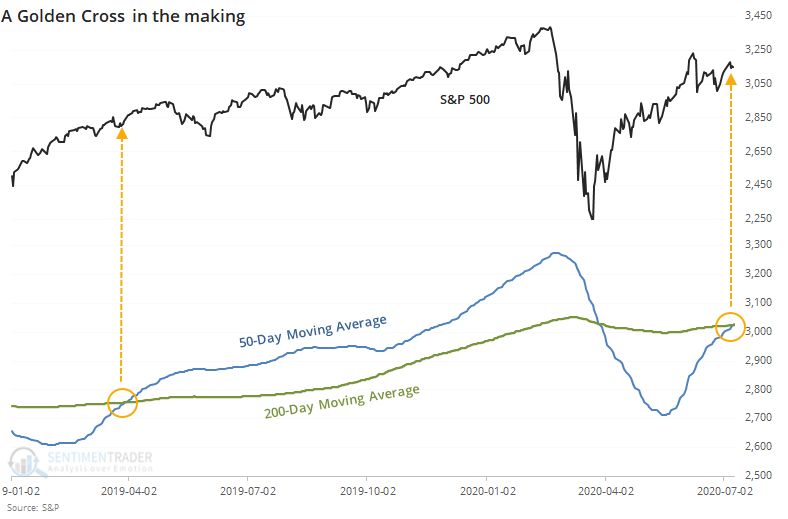
Barring some kind of disaster on Thursday, the S&P 500 will enjoy a Golden Cross, where the 50-day average moves above the 200-day average.

This interpretation is kind of a bastardized version of the averages that ostensibly originated in ancient Japan, but Americans, in particular, have an affinity for round numbers, and these two have become the standard.

We've looked at these kinds of technical signals across markets for decades, with the grudging conclusion that they're barely useful. When this triggered in 2019, stocks rallied...then gave it all back, so whether it was successful or not depends on one's time frame.

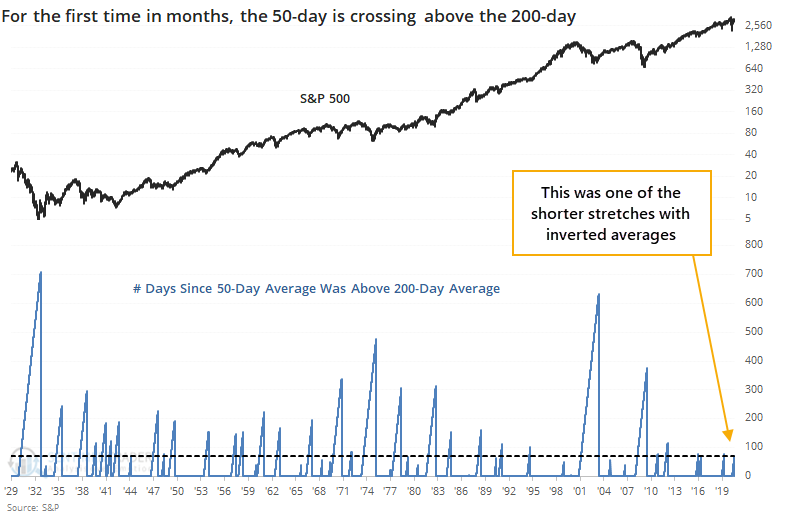
As streaks go, this was one of the shorter ones. The 50-day average was below the 200-day for only 70 sessions. The worst declines saw this go for 500 days or longer.

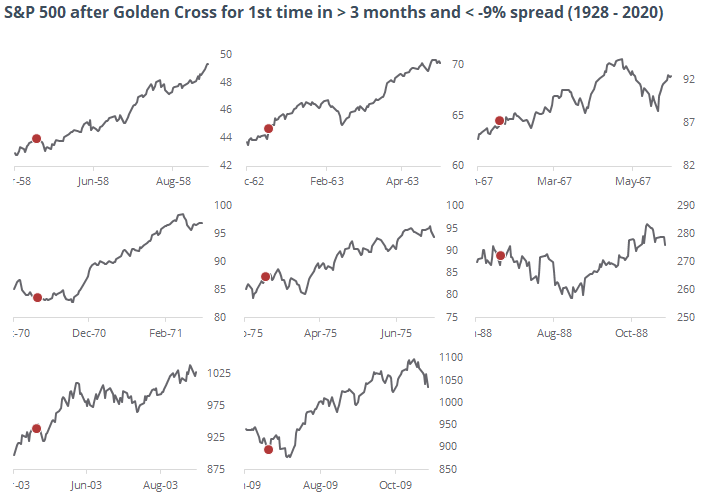
If we further stipulate that both moving averages must be rising, then the table below shows every signal since 1928 when the 50-day was below the 200-day for anywhere between 30 and 90 days.

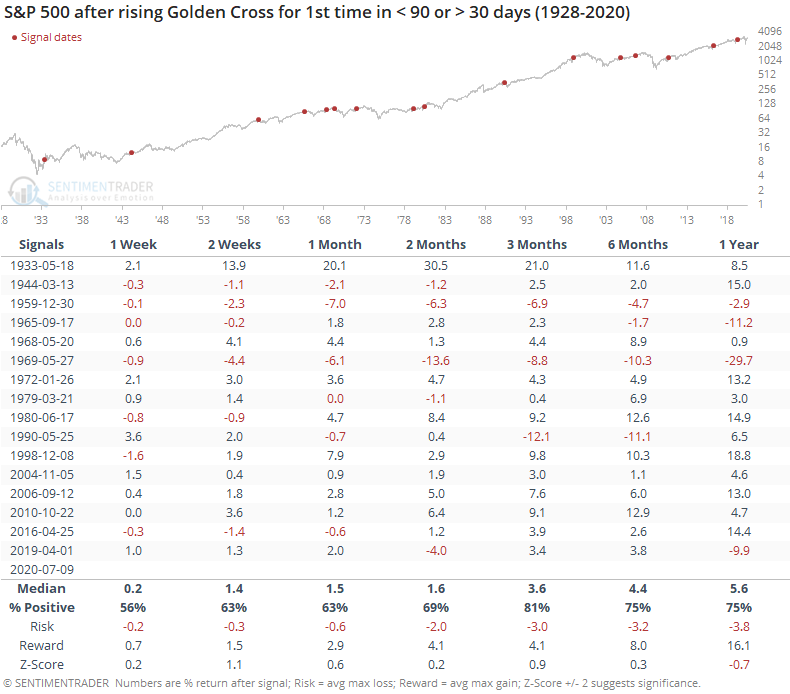
Future returns were okay. Median returns were about in line with random, and while reward was higher than risk, it wasn't positively skewed enough to consider it a big edge.

This one might be notable for another reason - it reversed what had been a very negative spread between the two averages. The S&P's 50-day average had dropped more than 9% below the 200-day average before reversing.

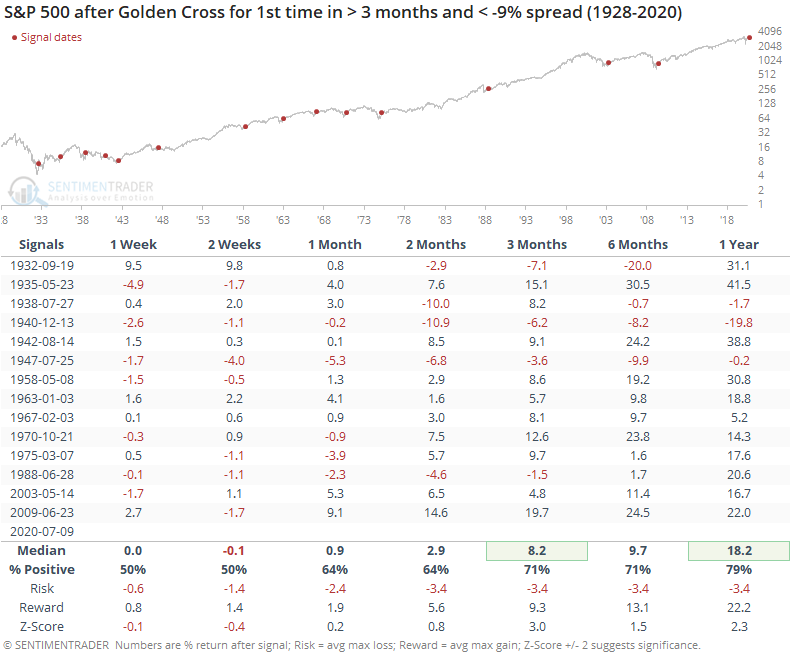
Shorter-term returns were sketchy, but from three months and beyond, mostly positive. This has been particularly positive since 1950, with extremely small risk relative to reward.

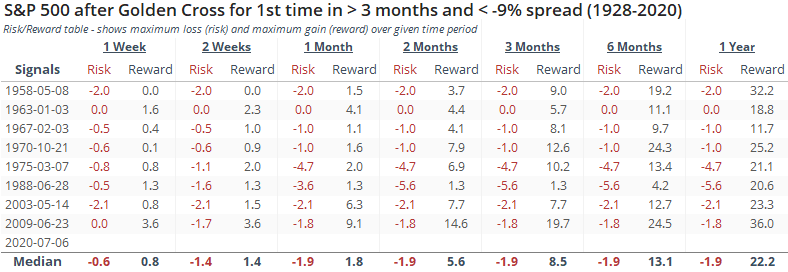
We wouldn't put a lot of faith in the Golden Cross by itself. The biggest reason for optimism is that it has reversed what had been a very negative medium- vs long-term trend, and that has led to big gains over the next 6-12 months every time over the past 70 years. During modern times, these signals marked the end of every major bear market. 

EDIT: The following thumbnail chart was added after this post was originally published.

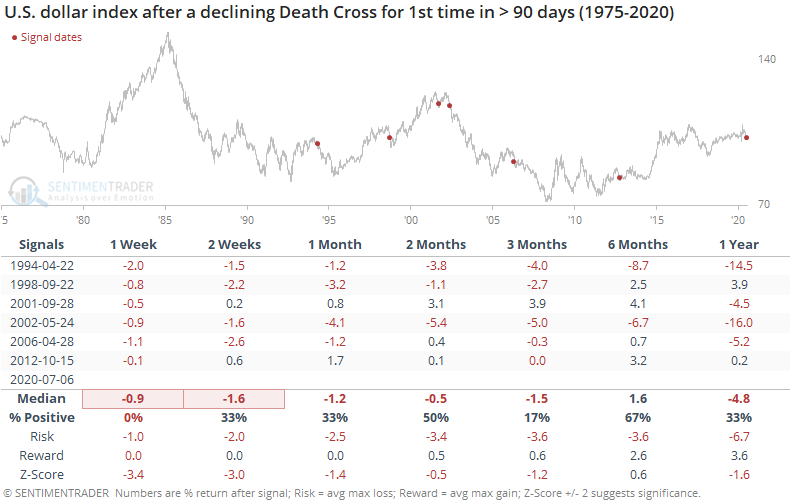
At the same time that the S&P's trend is turning positive, the U.S. dollar's is turning negative. The 50-day average just crossed below the 200-day average.

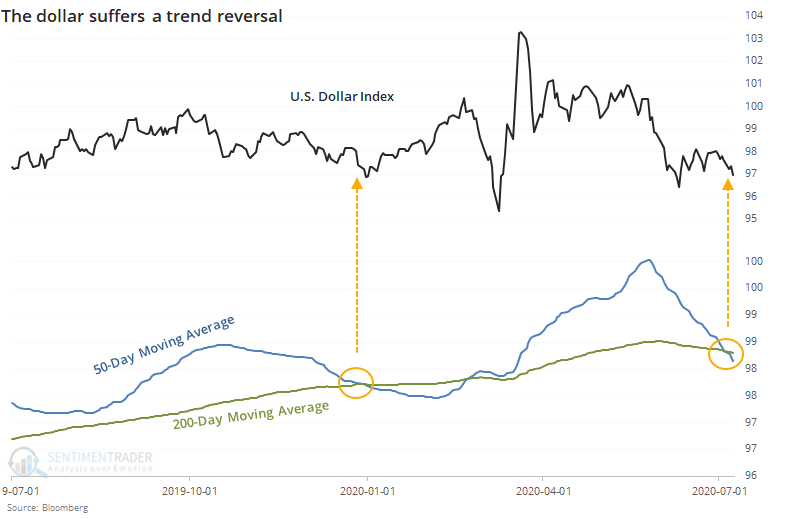
When this happened for the first time in at least 90 days, the buck had trouble regaining a positive trend.

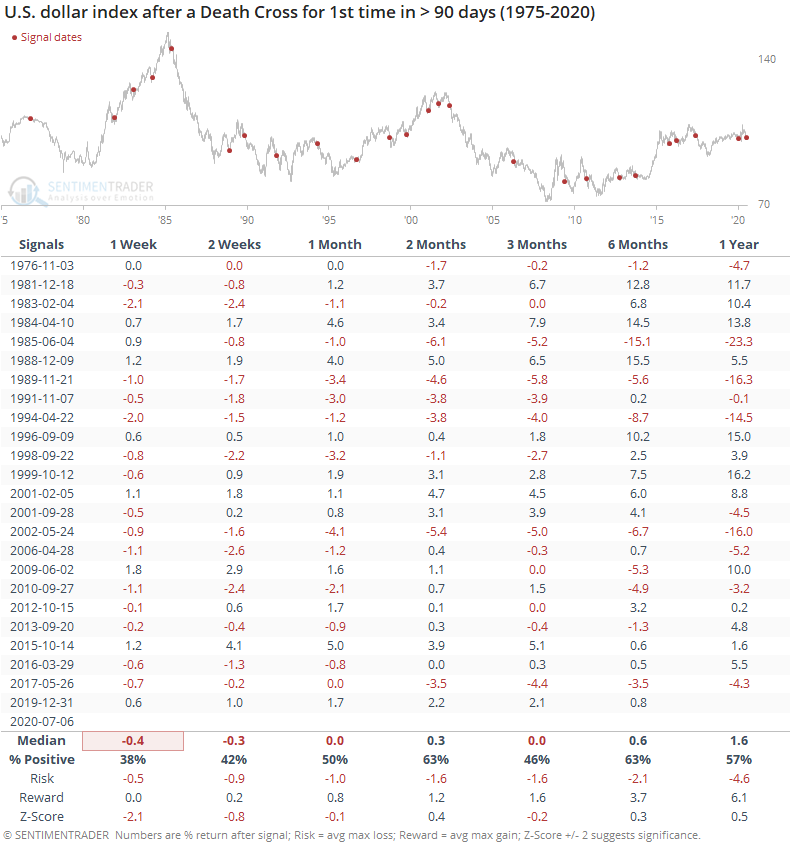
That was especially true if both moving averages were declining at the time of the cross, as they are now.

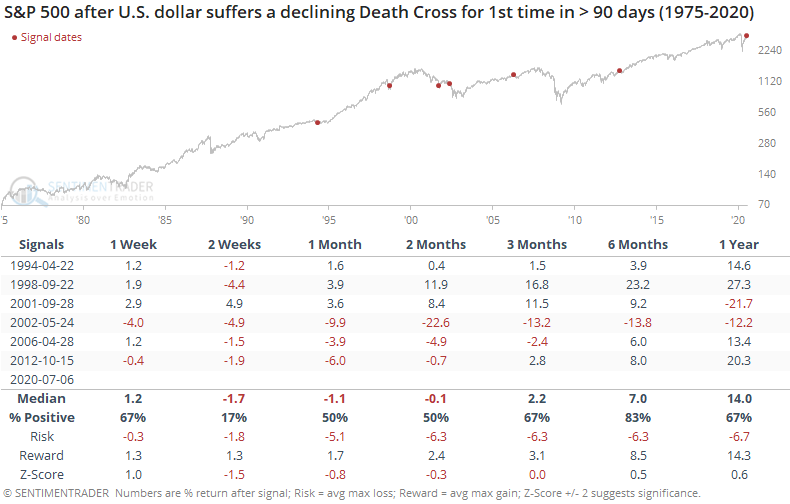
These signals preceded some short-term heartburn for the S&P 500, but not much beyond the first couple of months.

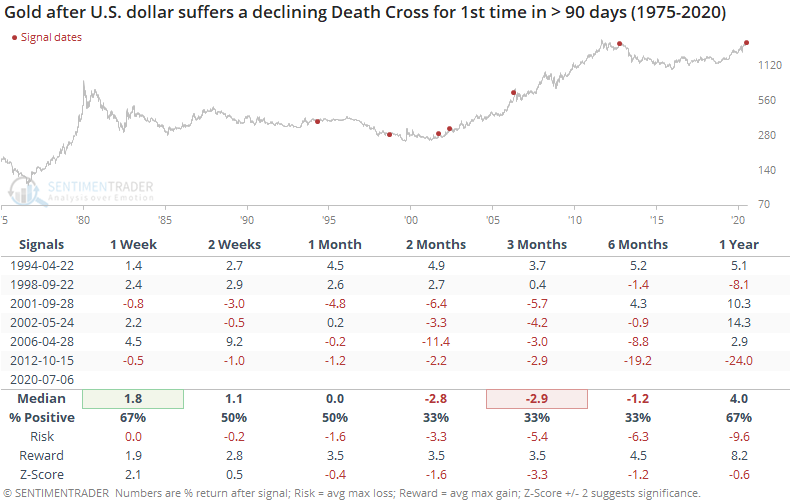
Surprisingly, gold didn't benefit that much from further declines in the dollar in the months ahead.

We'd take this potential trend change more as a bad sign for the dollar than as a good (or bad) sign for stocks or gold.

Sorry, you don't have access to this report

Upgrade your subscription plan to get access
Go to Dasboard
DATA &
TECHnologies
IndicatorEdge
‍
BackTestEdge
‍
Other Tools
‍
DataEdge API
RESEARCH
reports
Research Solution
‍
Reports Library
‍
actionable
Strategies
Trading Strategies
‍
Smart Stock Scanner
‍
FREE
RESOUrCES
Simple Backtest
Calculator
Simple Seasonality
Calculator
The Kelly Criterion
Calculator
Sentiment Geo Map
‍
Public Research Reports
‍
Free Webinar
COMPANY
‍
About
‍
Meet our Team
‍
In the News
‍
Testimonials
‍
Client Success Stories
Pricing
Bundle pricing
‍
Announcements
‍
FAQ
© 2024 Sundial Capital Research Inc. All rights reserved.
Setsail Marketing
TermsPrivacyAffiliate Program
Risk Disclosure: Futures and forex trading contains substantial risk and is not for every investor. An investor could potentially lose all or more than the initial investment. Risk capital is money that can be lost without jeopardizing ones’ financial security or life style. Only risk capital should be used for trading and only those with sufficient risk capital should consider trading. Past performance is not necessarily indicative of future results.

Hypothetical Performance Disclosure: Hypothetical performance results have many inherent limitations, some of which are described below. No representation is being made that any account will or is likely to achieve profits or losses similar to those shown; in fact, there are frequently sharp differences between hypothetical performance results and the actual results subsequently achieved by any particular trading program. One of the limitations of hypothetical performance results is that they are generally prepared with the benefit of hindsight. In addition, hypothetical trading does not involve financial risk, and no hypothetical trading record can completely account for the impact of financial risk of actual trading. for example, the ability to withstand losses or to adhere to a particular trading program in spite of trading losses are material points which can also adversely affect actual trading results. There are numerous other factors related to the markets in general or to the implementation of any specific trading program which cannot be fully accounted for in the preparation of hypothetical performance results and all which can adversely affect trading results.

Testimonial Disclosure: Testimonials appearing on this website may not be representative of other clients or customers and is not a guarantee of future performance or success.