
The Smart Money/Dumb Money Confidence Spread - Part II

Please note that these scans are not necessarily presented on a "timely" basis. The goal is two-fold:
- To help you learn more about the Backtest Engine and its potentially powerful uses
- To help you build an arsenal of scans that may ultimately prove to be very useful at just the right time
This piece offers a slightly different take on the method detailed in Part I here.
SMART MONEY / DUMB MONEY CONFIDENCE SPREAD - PART II
As the name implies, this indicator measures the daily difference between our "Smart Money" indicator value and our "Dumb Money" indicator value.
For this article:
A = (Smart Money value - Dumb Money value)
B = 10-day moving average of A
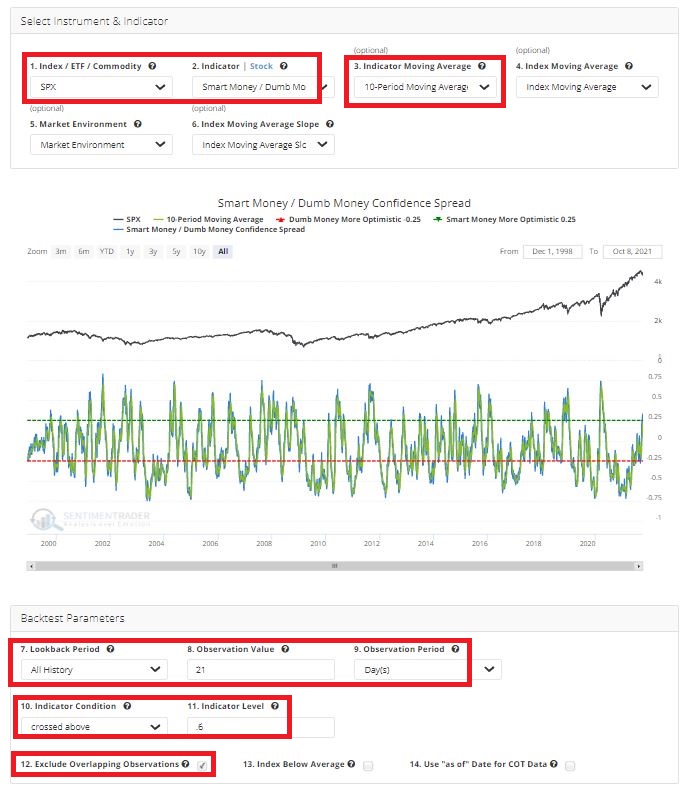
For our test, we will identify those days when:
- Variable B crosses above 0.60
- For the first time in 21 days
The screenshot below displays the input screen for this test (after you follow the steps below to Save this scan, anytime you recall it, the inputs will fill in automatically).
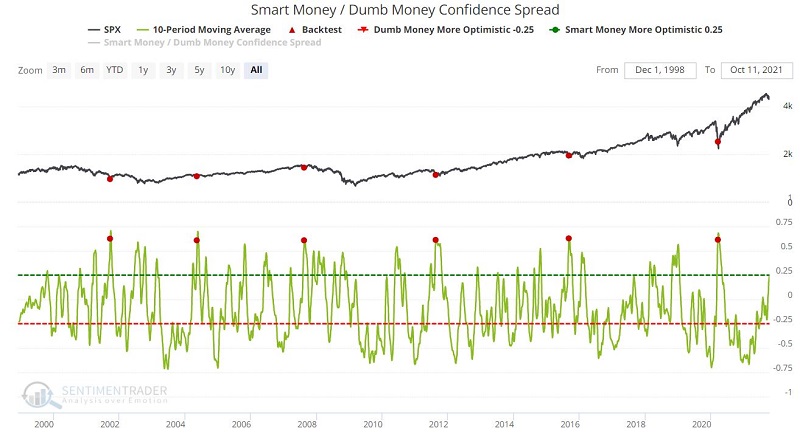
 The chart below displays the signals generated by this test. As you can see, this scenario occurs even less frequently than the scan we covered in Part I. With only 6 signals in 20 years, it certainly borders on encompassing too small of a sample size from which to draw any conclusions.
So, let's not draw any conclusions. Let's merely highlight the performance of the S&P 500 Index following previous signals, and each trader can decide for themselves whether or not adding this test to their list of saved Backtest Engine scans is worth saving or not.
The screenshot below displays the handful of signals generated by this particular test over the years.
 The screenshot below displays the summary of results as well as the output for each signal. The key thing to note is the 100% Win Rate for 2 weeks to 2 months and the solid Median Returns during these time periods.
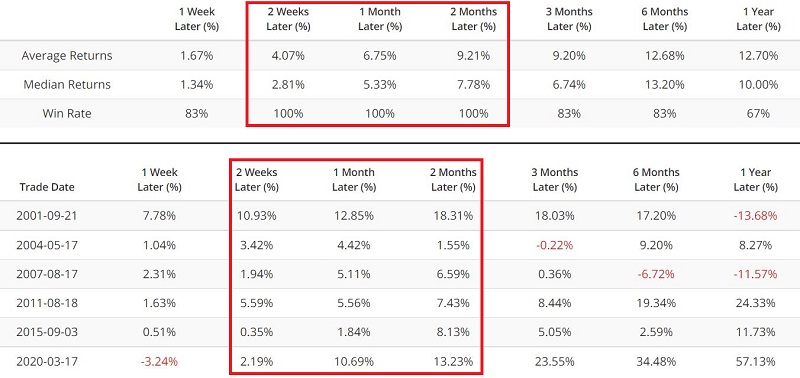
The bottom line:
- Signals from this particular scan are infrequent (and unfortunately, not close to triggering anytime soon)
- But when they do occur, short-term traders appear to have an outstanding opportunity to play the long side of the stock market
SAVING THE SCAN
To save this scan:
- Click "Add to Favorites"
- Typing "Smart/Dumb Confidence Spread 10-day MA crosses above 0.60" (or whatever description you would prefer)
- Then click "Save Favorite"
These steps will add this particular scan to your list of Favorites. Anytime you enter Backtest Engine, your Favorites will be listed at the bottom of the screen.
Finally, note that any Saved scan that is active is listed at the bottom of your Evening Digest email. You can go to My Website Preferences under My Account to ensure you get those (they are on by default).
SUMMARY
Waiting around for a signal from the indicators detailed in Part I and Part II is not really much of a strategy due to the infrequent nature of the signals. However, saving these scans and having any new signals that do occur pop up in your Evening Digest can allow you to be alerted to these potentially useful signals whenever they occur, without you having to monitor for new signals constantly.