The Smart and Dumb Money are about to flip
Key points:
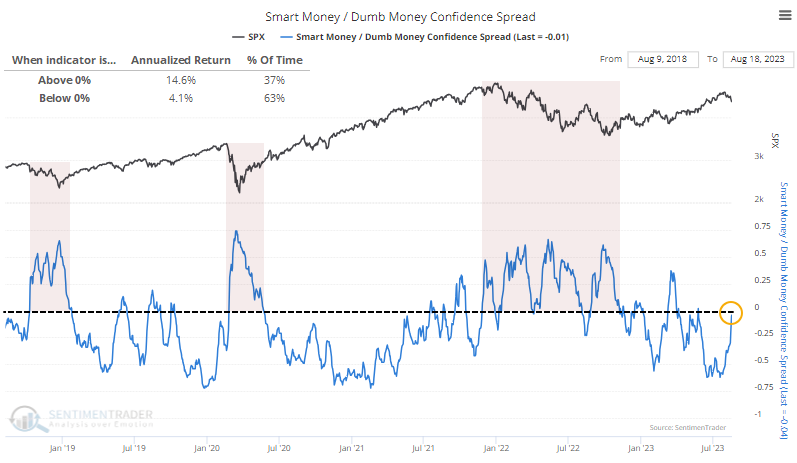
- The spread between Smart Money and Dumb Money Confidence is back to zero
- This is happening after months of a negative spread, which had reached extreme territory in July
- After behavior most similar to the past several months, the S&P 500 showed a strong tendency to rise
Traders are about to flip positions
For the first time in months, the Smart Money is about as confident in a stock market rally as the Dumb Money.
This is somewhat counterintuitive, but typically, we see this behavior during declining markets. The "dumb money" mostly reflects trend-followers, who tend to be correct during the meat of protracted trends but also grossly offside at turning points. The "smart money" tends to buy as stocks decline and sell as they rally, which doesn't look very smart during trending markets, but they also tend to be heavily long at market lows and neutral or short at peaks. Pick your poison.

Because of this dichotomy, when the spread between the two groups is positive, it tends to occur during rough markets. Staying out when the spread was positive (until it exceeded +0.5 anyway) would have kept a trader out of challenging markets in 2018, 2020, and 2022. But as we can see from the chart, the S&P's annualized return when the spread is positive has been more than triple the return when the spread was below zero. That's because the strongest days have occurred as stocks were bottoming; when the S&P 500 is in an uptrend, and the spread is negative, it tends to enjoy more consistent but smaller average daily gains.
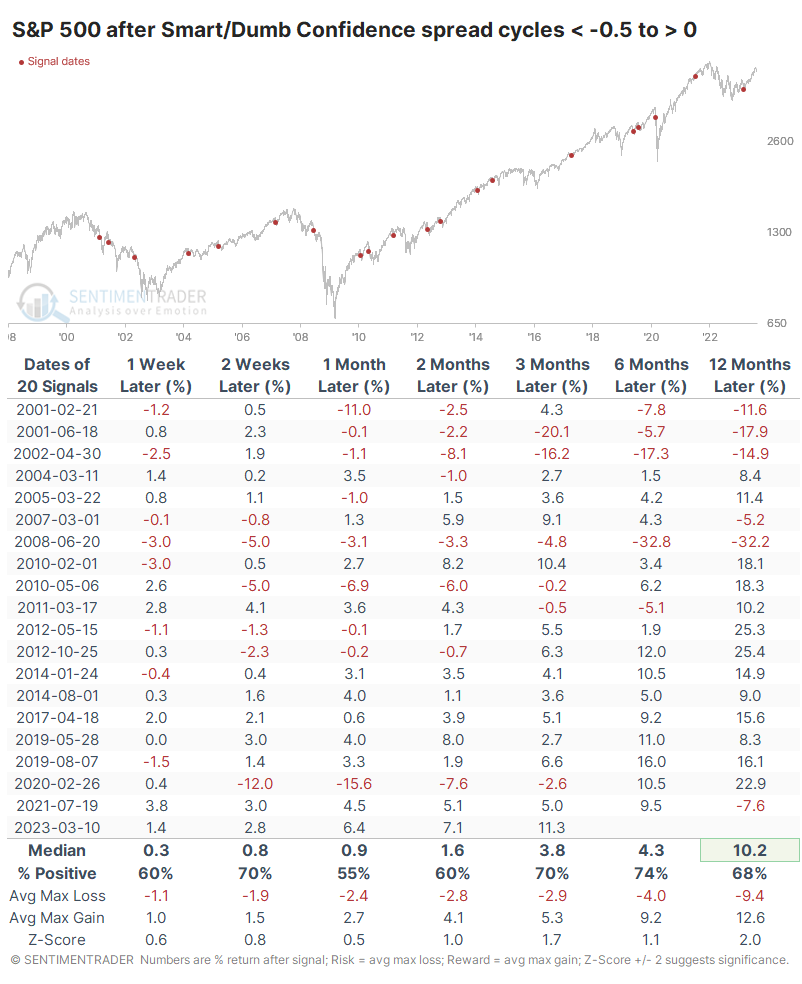
When the spread cycles from extreme negative back to neutral, the S&P has mostly shown gains in the weeks and months ahead. It preceded a waterfall decline during the pandemic and failed multiple times in 2001-02 and again in 2008, so the worst bear markets of the past 25 years. But most of the time, stocks are not stuck in generational declines, and forward returns were decent.
Normalized sentiment after bouts of extreme optimism
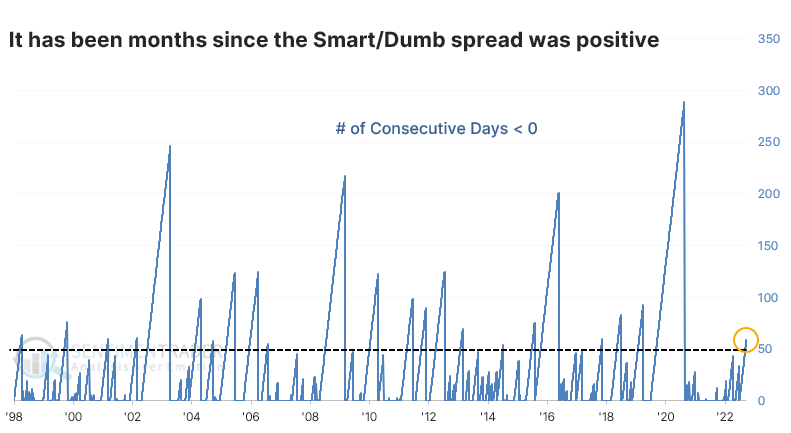
We try to add context when possible, and one important piece of context here is duration. The spread between Smart and Dumb Money Confidence had been negative for months. Streaks longer than 50 trading days have been relatively rare since we began computing this in 1998.
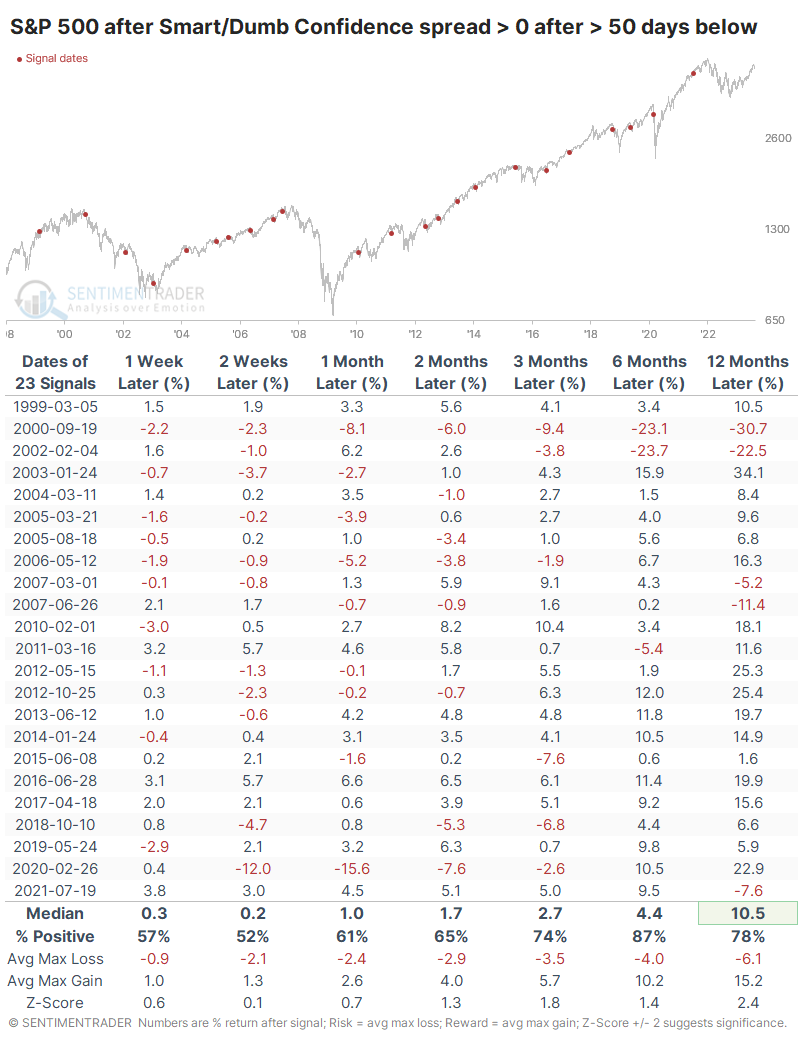
When the spread turned positive after spending at least 50 days below zero, returns were again decent but pretty mixed in the shorter term. There were a few uncomfortable losses in there.
When we combine the studies, we can approximate conditions most like the current ones. The table below shows the S&P's future returns when the spread had been extremely negative and was below zero for a protracted amount of time, then turned positive.
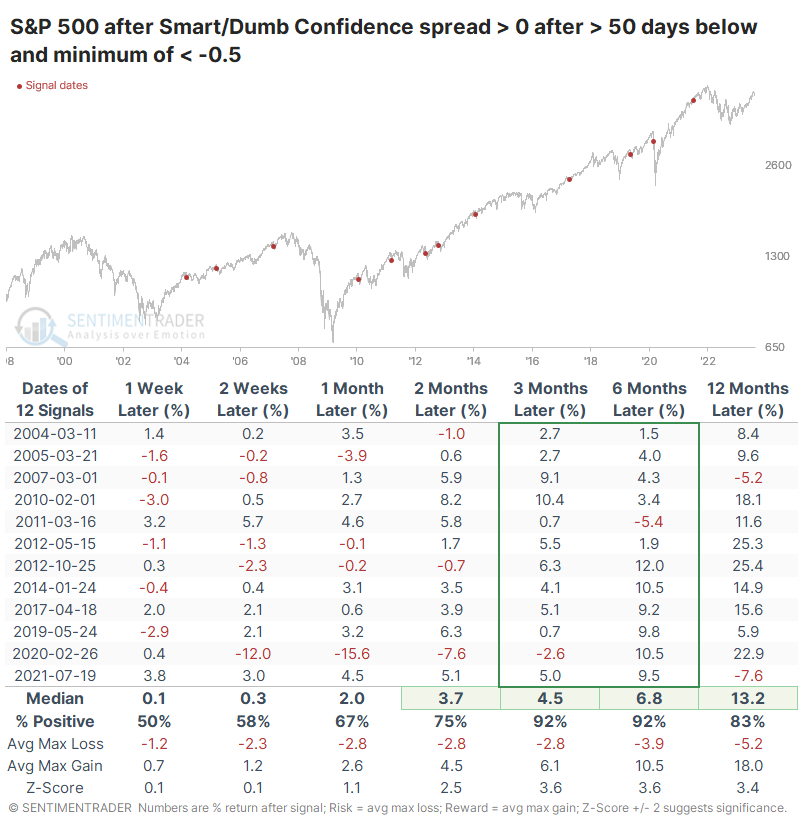
This was triggered during the once-in-a-century pandemic panic and preceded ugly losses. But outside of that outlier, these were not bear market signals. None of them happened during protracted declines, only during bull phases. As a result, the index's returns over the medium- to long-term were superior. Over the next 3-6 months, there was only a single minor and temporary loss.
What the research tells us...
Sentiment toward stocks has shifted quickly from excessive optimism in July. Across many indicators and models, we see a historically swift reversal in optimism. Bull markets need increasing optimism to keep going, so declining sentiment is not a good sign. What is a good sign is that sentiment got so optimistic in the first place and stayed there for a while. That doesn't happen during bear markets. So the probability is high that we're seeing a typical bull market panic. Most of the hallmark signs are there.

