The Smallest of Options Traders Gave Up

In January and February, sentiment was driven to a frenzy, primarily on the backs of wild-eyed options traders. YOLO mentality was in full effect, and options indicators were hitting records.
That didn't have much impact on the broader market. Even though tech stocks took a breather, and small-caps peaked for the year right about then, widely-followed indexes like the S&P 500 kept setting record highs. There was a rebound of speculative activity in June, and hedging activity all but disappeared. That's about when the NYSE Advance/Decline Line peaked, though yet again, it had no impact on the broader equity indexes.
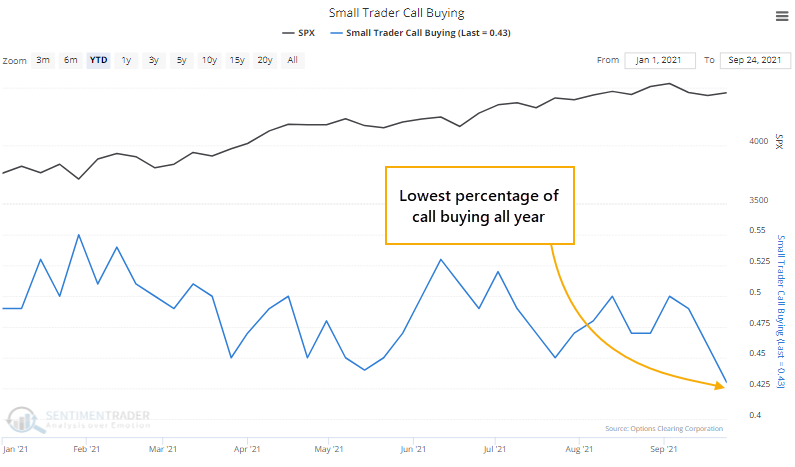
Deterioration under the surface of those indexes has dented investors' optimism, and many of the indicators we follow have moved back into neutral, or even slightly pessimistic, territory. Among options traders, that internal choppiness has led the smallest of traders to pull back significantly on their bullish bets.
Last week, these small traders spent only 43% of their volume buying speculative call options to open. That's the least concentration on outright bullish bets so far in 2021.
While less dramatic, they also increased their protective put buying. That caused the ROBO Put/Call Ratio to rise to the 2nd-highest level of the year, next to the week ending May 14.
Due to a spike in implied volatility, they were also paying up a bit more for those put options relative to calls. The Small Trader Put/Call Premium indicator shows that they spent about half as much on puts as calls, the 3rd-highest ratio of the year.
So, based on very recent history, we could make an argument that speculative activity has been wrung out among the traders most likely to show emotional extremes, and that should be good for stocks going forward. If we're still in the same environment that we've been in all year, then sure, that's valid.

What else we're looking at
- A look at 20 years of speculative options trading activity
- What a broad look at bullish vs. bearish options trading last week looks like
- Forward returns in the S&P 500 since June 2020 when options activity looks like it did last week
- An update on absolute and relative trends in industry, sector, and country ETFs
- Taking a look at backtested returns in tech ETFs after those stocks see a drop in members above their 10-day averages
| Stat box The XOP Oil & Gas fund took in more than $180 million in assets on Monday. Over the past week, it has averaged an inflow of more than $70 million per day, only the 3rd time in the past decade it has seen that level of interest among traders. |
Etcetera
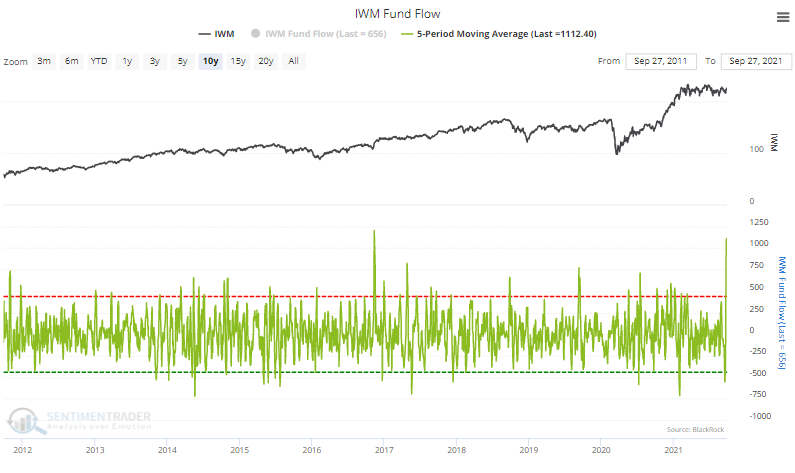
Big flows. The go-to ETF for small-cap shares, IWM, has taken in an average of more than $1 billion per day over the past week. That's the 2nd-highest amount in the past decade, next to a surge following the 2016 presidential election.
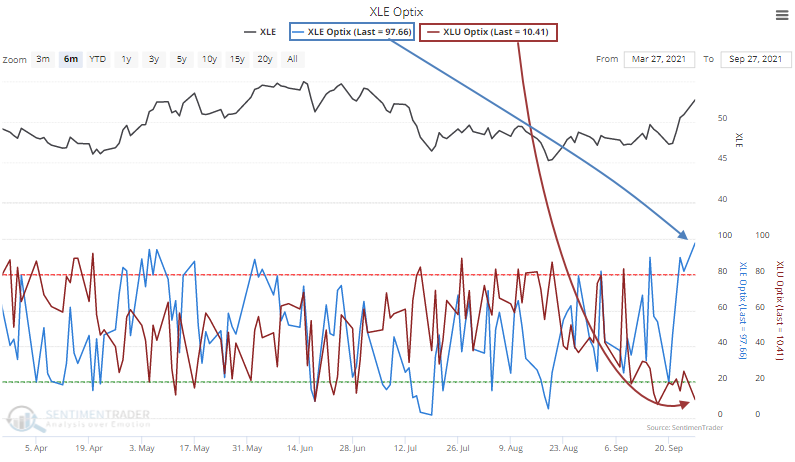
Yay energy, boo utilities. Traders have given up on utilities stocks, with the XLU having lowest Optimism Index (Optix) of any fund we follow. At the opposite end of the spectrum, the Optix for the XLE energy fund is near the top of the optimism rankings.
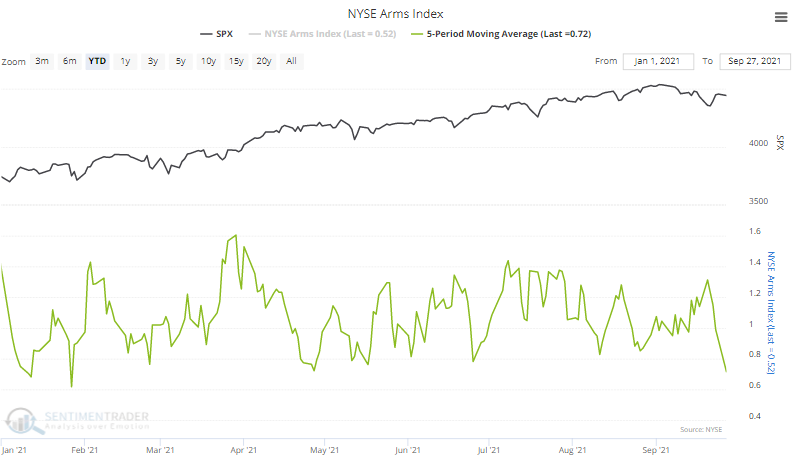
No Arm, no foul. The Arms Index, also known as the TRIN, has plunged to the 3rd-lowest level of the year over the past week. The indicator shows that buyers have concentrated much more volume in advancing securities than declining ones during the latest rebound attempt.