The Seasonal Window for Silver is Opening Right Now
According to Jay Kaeppel, part of his job is to help people "think like a trader."
One problem is that no two people look at the markets in exactly the same way. So, where one person sees opportunity, another person sees risk (come to think of it, that is kind of why the markets exist in the first place).
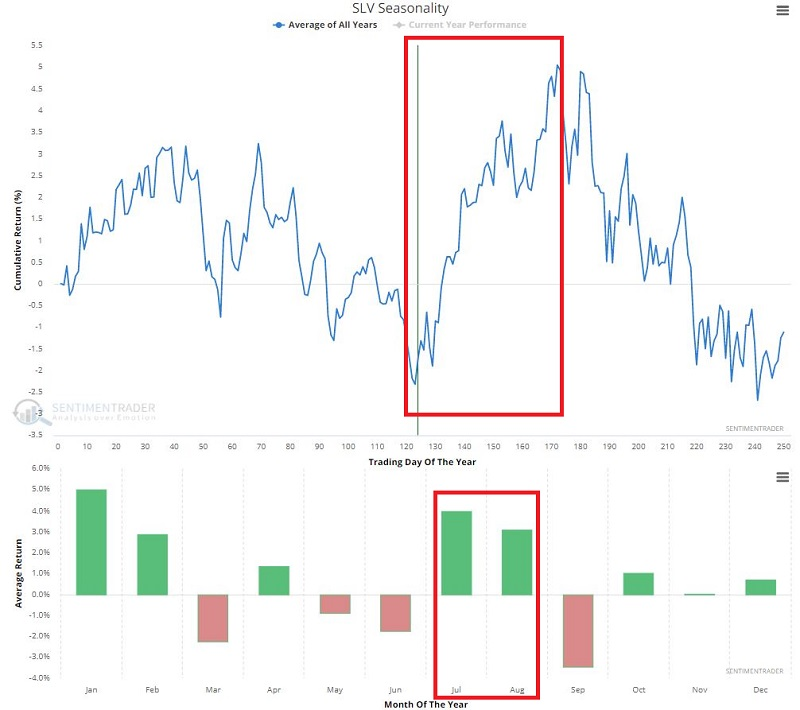
A good opportunity for that thinking is happening now in silver. The chart below displays the Annual Seasonal Trend for ticker SLV (iShares Silver Trust ETF).

Right now, we are entering a purportedly favorable time of year for silver. The first major thrust lasts from the end of June through early August, with its seasonal peak occurring in early September.
Does this mean that SLV is guaranteed to race higher in the months ahead? Not at all. Every year is its own roll of the dice. But if we look to put the odds on our side, this seems like a decent place to start.
Trend-wise, one can argue that SLV has gone nowhere for roughly 11 months. At the same time, another trader might focus on the daily chart and decide that with the 50-day average above the 200-day average and with the price of SLV still holding (just barely) above the 200-day average, the trend of SLV is still "up and to the right."
Implied Volatility for SLV options is not rock bottom, but it has come down a great deal from the levels in 2020 and early 2021. This matters because it means that the amount of time premium built into the price of SLV options has declined dramatically and that buying premium is a viable approach.
So, if one wanted to think like a trader and make a defined-risk trade that SLV will repeat its seasonal pattern while holding within its uptrend, options are a good alternative to committing all the capital it would take to buy SLV shares.
What else we're looking at
- A more detailed look at a trade involving SLV options
- What happens when SPY closes at a 52-week high ahead of an exchange holiday
- The tendencies in the S&P 500 after 6 straight closes at a 52-week high
- Why the bounce in airline shares may not last
| Stat box For the 19th time in the past 20 years, the S&P 500 closed at a 52-week high the day before an exchange holiday. After the other 18 instances, the index struggled over the next few days after traders returned from the break. |
Etcetera
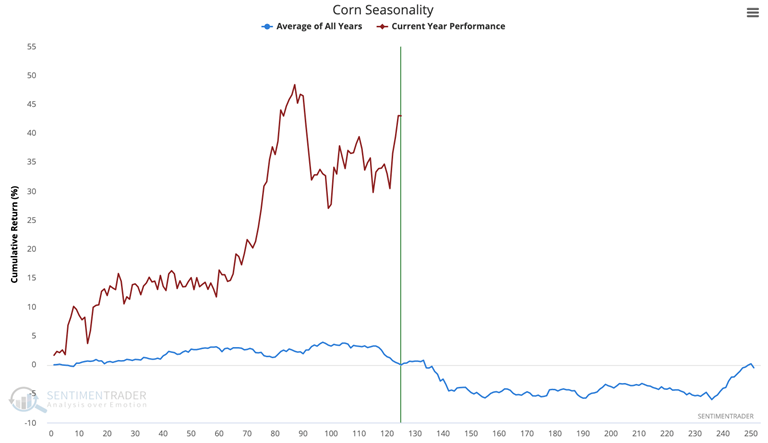
Pop corn. Corn has roughly followed its average seasonal trend in 2021 but has diverged lately. The commodity tends to drift lower into the summer months but has held up better so far this year.

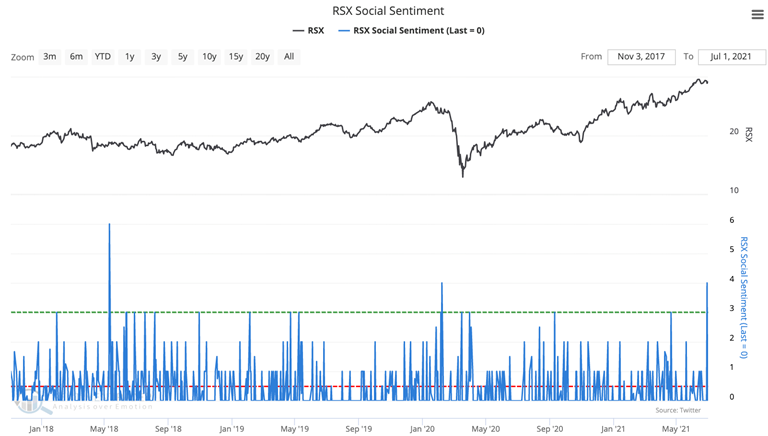
4 to 1. On social media, Twitter users were just 4 times more likely to post a negative message about the RSX Russia ETF than a positive one. That's tied for the 2nd-highest reading in 3 years.

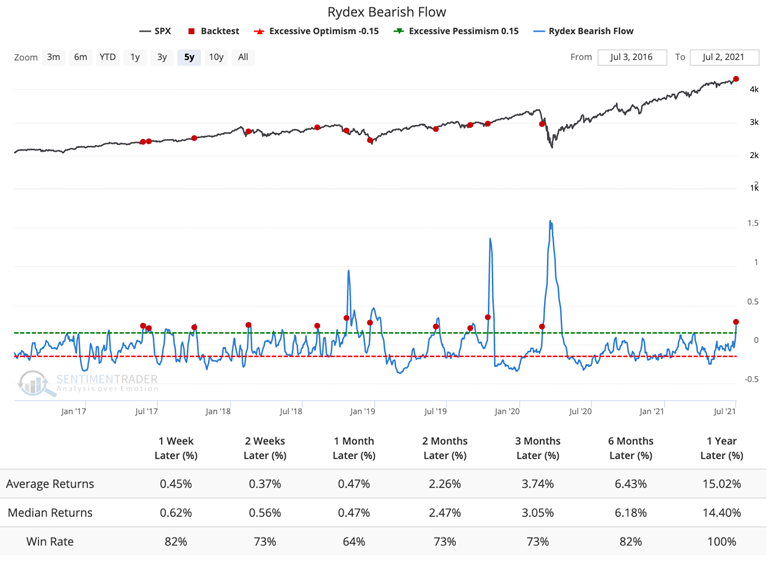
Bears can climb? The short-term trend of flows into Rydex bearish funds is 29% higher than the longer-term trend. According to our Backtest Engine, every other time it got this high in the past 5 years, stocks rallied over the next year.

 | Our Backtest Engine allows users to test virtually every indicator our service offers in seconds. You can change indexes, parameters, trends, and lookback periods and see how it impacts future returns. We're working hard on version 2.0 which will allow even more flexibility. |


