
The Santa Claus corn rally

Key points:
- A relatively short timeframe during December has tended to see higher prices for corn futures
- This period has seen corn gain in price 89% of the time since 1961
Corn seasonality turns positive now
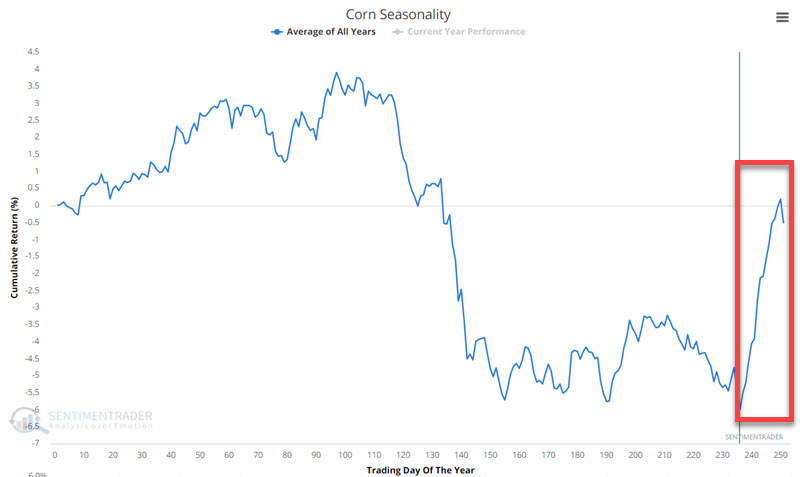
The chart below displays the annual seasonal trend for corn futures. Note that corn is presently entering a favorable seasonal period.
Let's take a closer look at performance during this period.
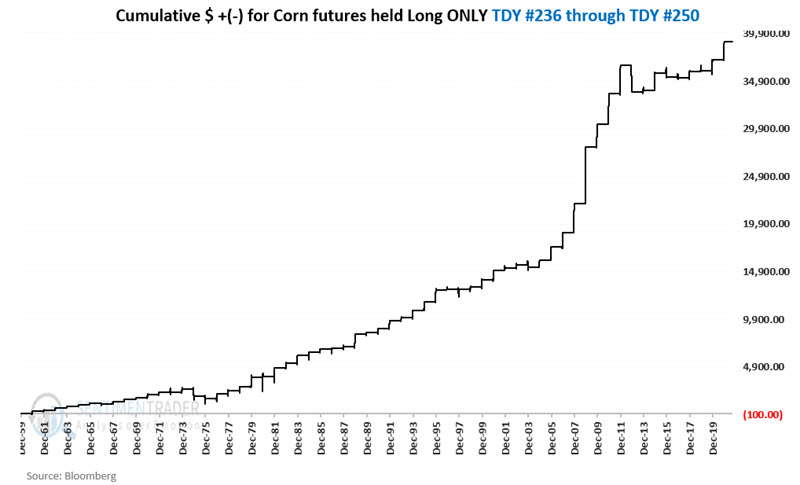
For this test, we will examine the performance of corn futures between Trading Day of the Year (TDY) #236 and TDY #250. The chart below displays the cumulative hypothetical $ + (-) achieved by holding a long 1-lot position in corn futures ONLY during this period every year starting in 1960.
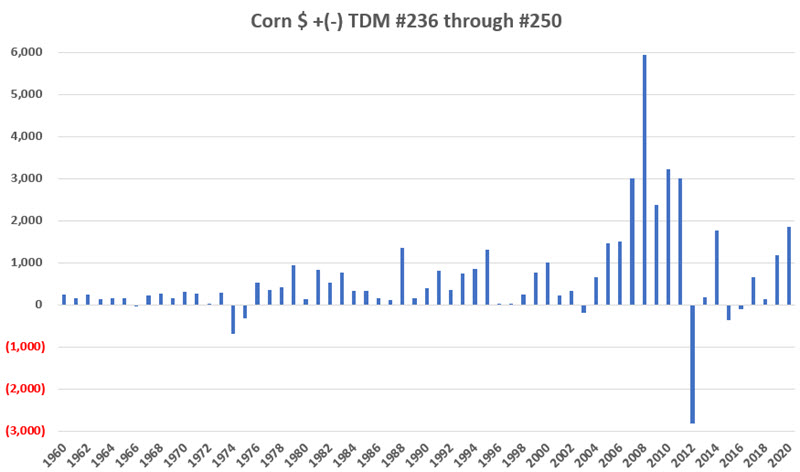
The year-by-year results show how consistently profitable this window has been, though there was that exceptional outlier in 2012.
Over the past 61 years, 54 of them showed a gain during these roughly 3-week stretches with an average gain that was more than double the average loss.
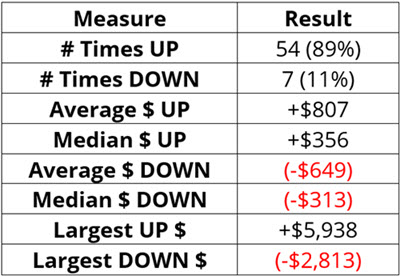
The outsized loss in 2012 reminds us that - from a real-world trading perspective - no matter how consistently any price trend, strategy, factor, or seasonal trend performs, the first job of a trader is risk control and making sure one can withstand the inevitable outlier.
What the research tells us...
Corn futures have shown a gain 89% of the time during a seasonally favorable timeframe that starts now and runs through approximately year-end. The average and median gain are far larger than the average and median loss, though the outlier from 2012 is a good reminder that even the most consistent setups can sometimes fail in a big way.