
The Risk On/Off indicator shifts upward, triggering a buy signal

Key points:
- The Risk On/Off indicator surged higher relative to its recent range, prompting a new buy signal
- Similar precedents displayed outstanding returns, win rates, and significance relative to random returns
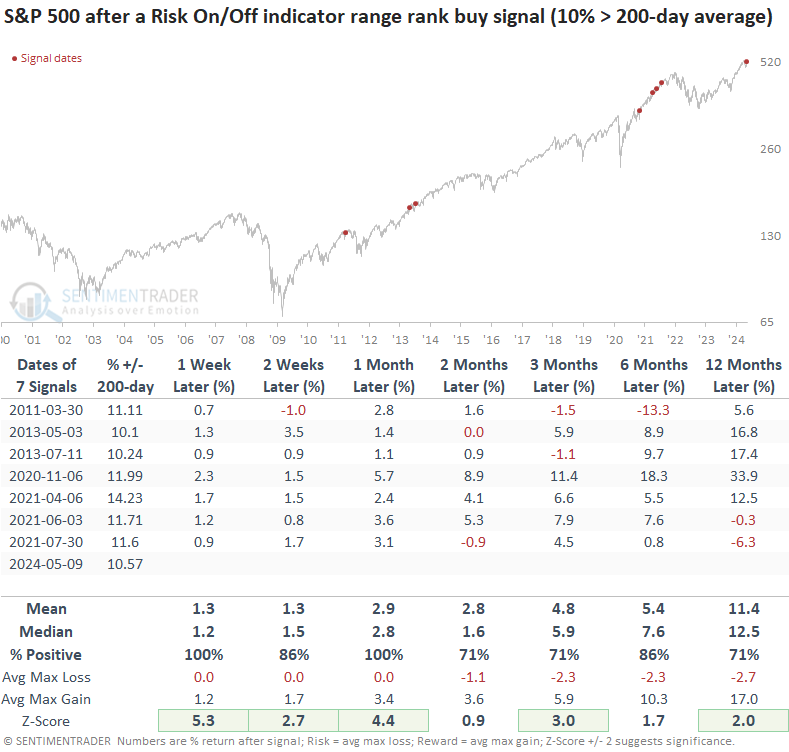
- In cases where the S&P 500 resided 10% above its 200-day, the index was higher every time a month later
The Risk On/Off indicator shifts upward, signaling improvement from breadth and sentiment measures
The Risk On/Off indicator, a composite encompassing 21 diverse sentiment and breadth-based measures, offers versatility in its application.
Traders or investors might leverage the indicator in one of the following ways:
- The indicator can function as an overlay with other trading signals or strategies. Readings above 50 indicate a risk-on scenario, while below 50 suggest a risk-off situation. For example, your system would initiate a long position only when the indicator is above 50.
- As a standalone strategy, historical testing revealed that going long the S&P 500 when the indicator exceeds 67 and selling when it falls below 35 yielded the most favorable results.
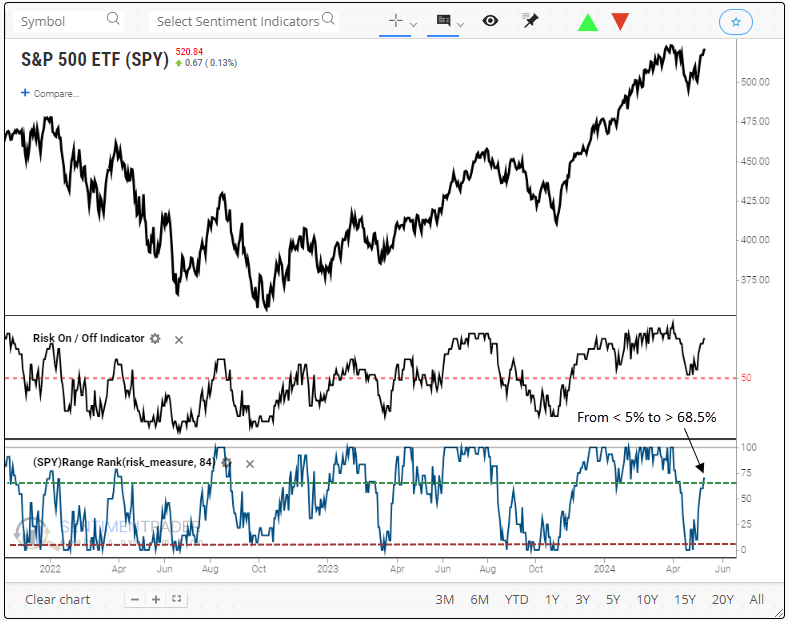
- One could employ a swing trading system by applying a range rank to the indicator. In this approach, traders would establish a long position in the S&P 500 when the rank transitions from less than 5% to greater than 68.5%.
This final methodology, the swing trading approach, triggered a new buy signal when the 84-day range rank for the Risk On/Off indicator cycled from less than 5% to greater than 68.5%. The previous alert occurred in November 2023, leading to an 11% gain for the S&P 500 over the subsequent three months.
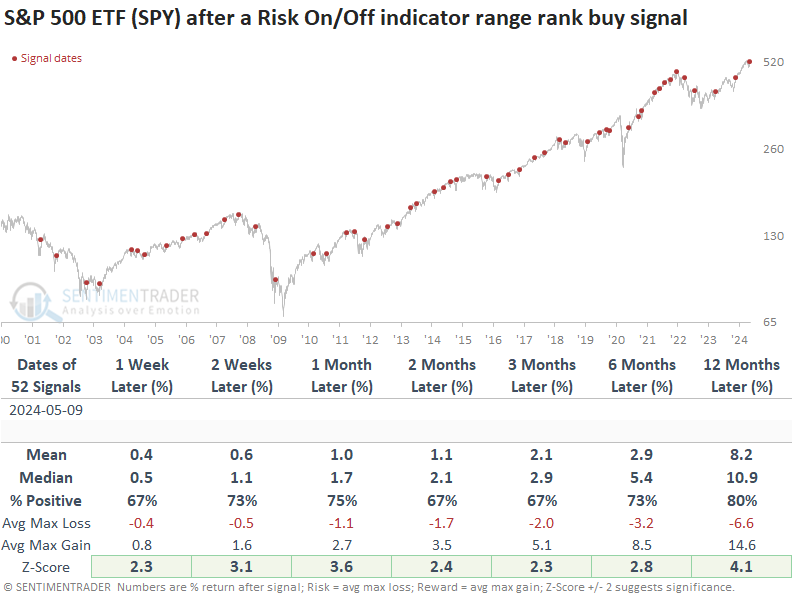
Similar range rank reversals generated an exceptional outlook
Following range rank reversals for the Risk On/Off indicator, the S&P 500 ETF (SPY) displayed outstanding returns and win rates across all time frames. Additionally, the swing trading methodology demonstrated statistical significance in every time horizon when contrasting signal returns against random returns over the study period.
Remarkably, between 2011 and 2017, the system demonstrated its prowess by achieving 15 consecutive winning trades over a one-month interval.
The most recent alert occurred with the S&P 500 more than 10% above its 200-day average. Despite what might appear to be an overbought condition, precedents under this context maintained excellent results. Over the subsequent month, the S&P 500 ETF (SPY) was higher every time.
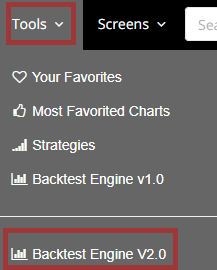
How can I recreate this signal in the Backtest Engine?
On the subscriber website, select Backtest Engine V2.0 under the Tools dropdown. When the engine page loads, it will default to the S&P 500. You can use the index or change the symbol to the S&P 500 ETF (SPY).
Complete the following tasks in the Entry Criteria section:
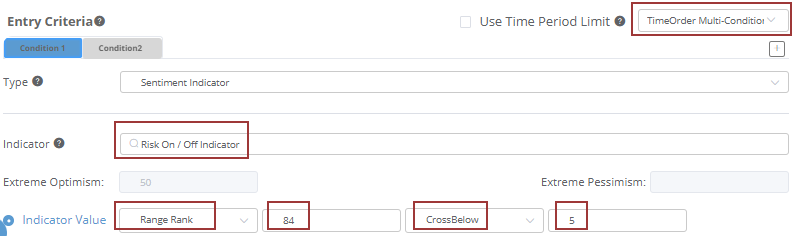
- Select TimeOrder Multi-Condition in the top right-hand corner
- In the Indicator search box, type Risk On/Off and select the indicator
- In the Indicator Value dropdown, choose Range Rank, change the lookback from 21 to 84, select CrossBelow, and enter 5
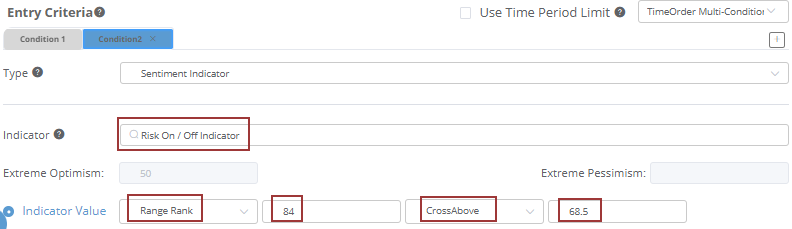
Click on the Condition2 tab and complete steps 2 and 3 from above. However, this time, select CrossAbove and enter 68.5.
Finally, click on the Run Backtest button. Once complete, make sure to save the trading signal to your favorites folder.
What the research tells us...
After descending to the lower end of its 84-day range, the Risk On/Off indicator surged upward, signaling a resurgence across a broad spectrum of breadth and sentiment indicators. Similar precedents produced excellent returns and win rates for the world's most benchmarked index. Consequently, we can now include this new signal to the expanding list of items on the bullish side of the ledger, suggesting the recent month-long retreat in indexes served as a rejuvenating pause within a bullish long-term trend setting.