Data &
Technology
Research
Reports
Report Solutions
Reports Library
Actionable
Strategies
Free
Resources
Simple Backtest Calculator
Simple Seasonality Calculator
The Kelly Criterion Calculator
Sentiment Geo Map
Public Research Reports
Free Webinar
Pricing
Company
About
Meet Our Team
In the News
Testimonials
Client Success Stories
Contact
Log inLoginSign up
< BACK TO ALL REPORTS

The rise in rates reaches an extreme level

Jason Goepfert
2021-02-11
The yield on 10-year Treasury notes has risen steadily, as has the yield curve. Both are now more than 1.5 standard deviations from their 1-year average. This has led to mostly higher stocks and commodities, with a lower dollar.

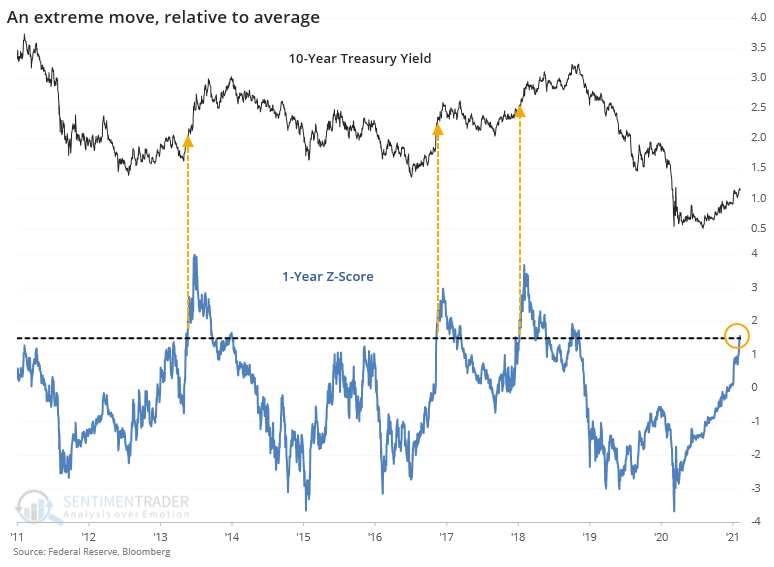
The march higher in the yield on 10-year Treasury notes took a breather in recent days, but it's mostly been a steady rise for most of the last 6 months.

So much so that the 1-year z-score, a measure of how unusual the move is relative to recent history, just reached 1.5 standard deviations for the 4th distinct time in the past decade.

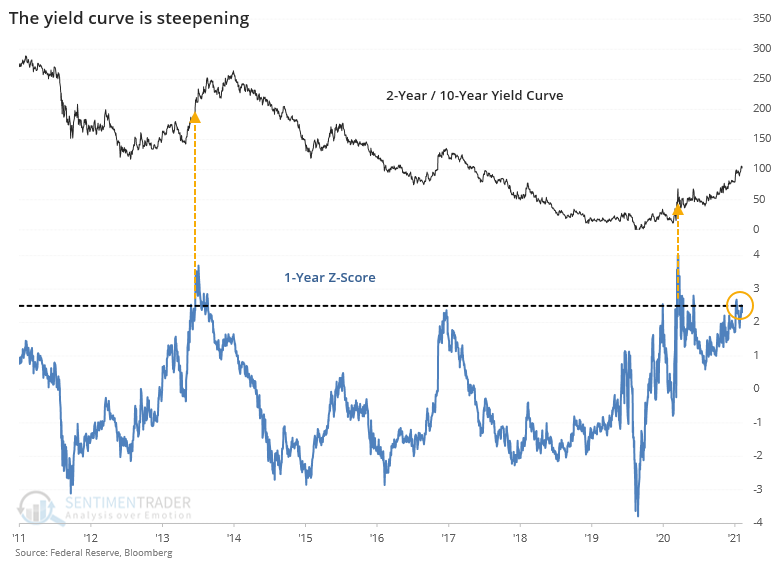
The push higher in rates has been focused mostly on the longer end of the Treasury yield curve, so the 2-year / 10-year spread has also made an extreme move.

This is typically taken as a reflection of economic growth and should be a positive for stocks going forward. When both the yield on 10-year notes and the yield curve were more than 1.5 deviations above trend, that mostly proved true. Over the next couple of months, there were only a couple of small losses.

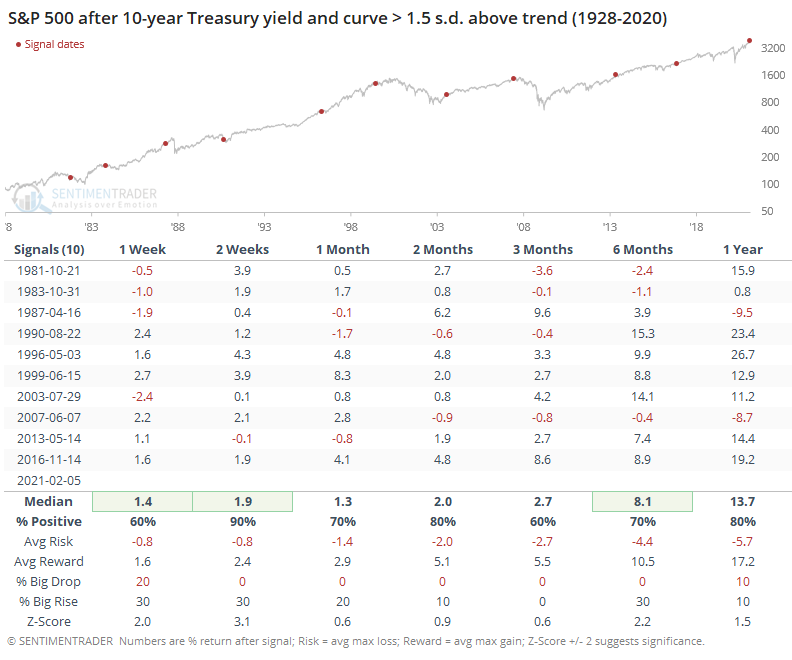
From the chart, we can see little red dots near the peaks in 1987, 2000, and 2007, but they triggered well before stocks peaked. Returns over the medium-term were middling, as was the risk/reward ratio, but overall there was a modest positive bias.

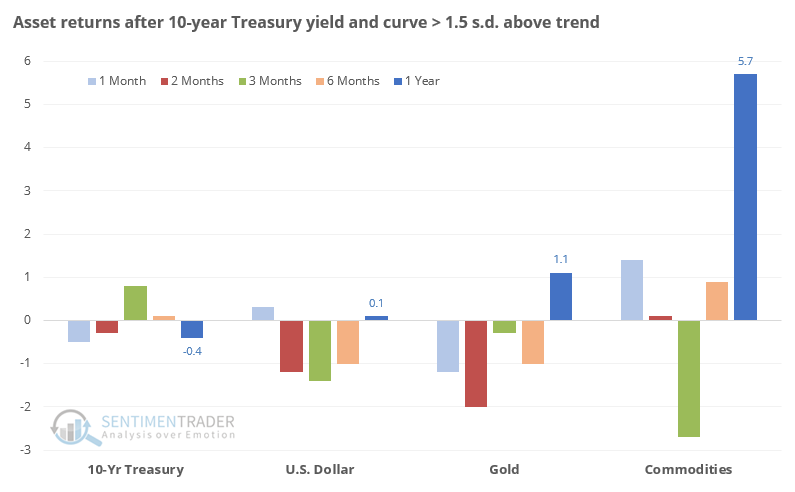
As for other assets, it preceded mostly negative returns, with commodities holding up the best over the next year. That is a general basket of commodities weighted by trading volume and world production as calculated by Bloomberg.

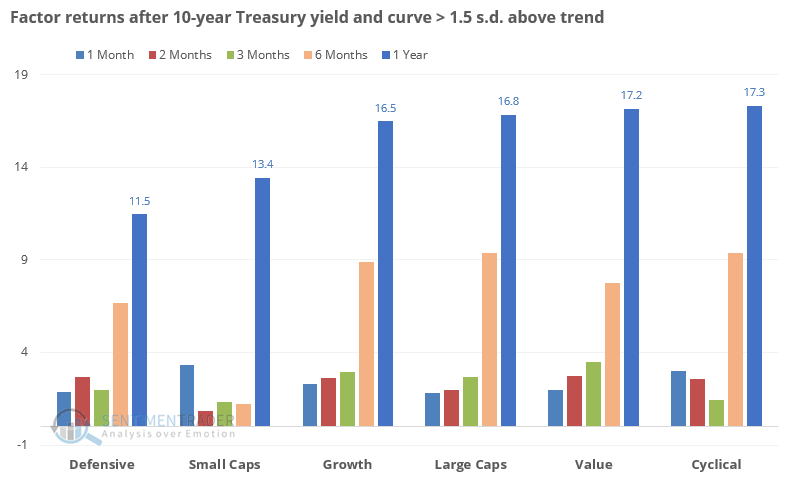
Among equity factors, returns were fairly balanced. Surprisingly so, actually. There was a bit of a medium-term blah among small-cap stocks, but other than that, there wasn't much of a bias between them.

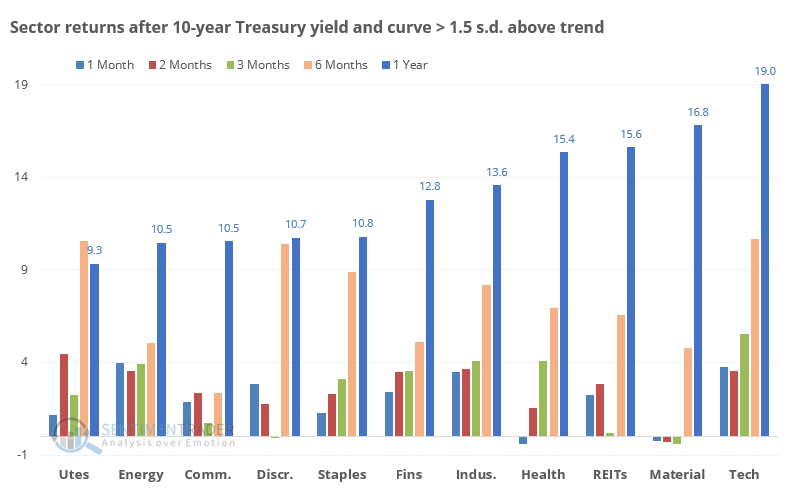
It's also perhaps surprising that among major sectors, tech stocks showed the largest gains a year later. One of the bearish arguments right now for tech is that rising rates will cause investors to reprice the risk inherent in a sector where so many companies are struggling to turn a profit. Energy, financial, and industrial stocks also held up well across time frames.

Ask 10 investors about what the rise in rates is likely to mean, and you're likely to get 10 different responses. We're at such a unique moment in history that perhaps history isn't any guide at all. From what we can determine, though, the trend of rising rates, which ostensibly signals an economic recovery, is more of a modest point in bulls' favor than bears.

Sorry, you don't have access to this report

Upgrade your subscription plan to get access
Go to Dasboard
DATA &
TECHnologies
IndicatorEdge
‍
BackTestEdge
‍
Other Tools
‍
DataEdge API
RESEARCH
reports
Research Solution
‍
Reports Library
‍
actionable
Strategies
Trading Strategies
‍
Smart Stock Scanner
‍
FREE
RESOUrCES
Simple Backtest
Calculator
Simple Seasonality
Calculator
The Kelly Criterion
Calculator
Sentiment Geo Map
‍
Public Research Reports
‍
Free Webinar
COMPANY
‍
About
‍
Meet our Team
‍
In the News
‍
Testimonials
‍
Client Success Stories
Pricing
Bundle pricing
‍
Announcements
‍
FAQ
© 2024 Sundial Capital Research Inc. All rights reserved.
Setsail Marketing
TermsPrivacyAffiliate Program
Risk Disclosure: Futures and forex trading contains substantial risk and is not for every investor. An investor could potentially lose all or more than the initial investment. Risk capital is money that can be lost without jeopardizing ones’ financial security or life style. Only risk capital should be used for trading and only those with sufficient risk capital should consider trading. Past performance is not necessarily indicative of future results.

Hypothetical Performance Disclosure: Hypothetical performance results have many inherent limitations, some of which are described below. No representation is being made that any account will or is likely to achieve profits or losses similar to those shown; in fact, there are frequently sharp differences between hypothetical performance results and the actual results subsequently achieved by any particular trading program. One of the limitations of hypothetical performance results is that they are generally prepared with the benefit of hindsight. In addition, hypothetical trading does not involve financial risk, and no hypothetical trading record can completely account for the impact of financial risk of actual trading. for example, the ability to withstand losses or to adhere to a particular trading program in spite of trading losses are material points which can also adversely affect actual trading results. There are numerous other factors related to the markets in general or to the implementation of any specific trading program which cannot be fully accounted for in the preparation of hypothetical performance results and all which can adversely affect trading results.

Testimonial Disclosure: Testimonials appearing on this website may not be representative of other clients or customers and is not a guarantee of future performance or success.