Data &
Technology
Research
Reports
Report Solutions
Reports Library
Actionable
Strategies
Free
Resources
Simple Backtest Calculator
Simple Seasonality Calculator
The Kelly Criterion Calculator
Sentiment Geo Map
Public Research Reports
Free Webinar
Pricing
Company
About
Meet Our Team
In the News
Testimonials
Client Success Stories
Contact
Log inLoginSign up
< BACK TO ALL REPORTS

The ratio of gold to copper shows returning risk appetite

Jason Goepfert
2020-10-21
For the first time in well over a year, the ratio of gold to copper has dropped to a 6-month low. This suggests that traders see more value in economic growth (copper) than safety (gold). After other times the ratio hit a 6-month low, stocks did okay, while bonds, and the metals themselves, tended to drop.

The safety trade is starting to fade.

During times of duress, traders often flee to the perceived safety of gold. During economic booms, they gravitate toward copper, which has more industrial utility. So, watching the ratio of gold to copper can provide a sense of whether traders are looking for safety or a play on economic growth. That's the theory, anyway.

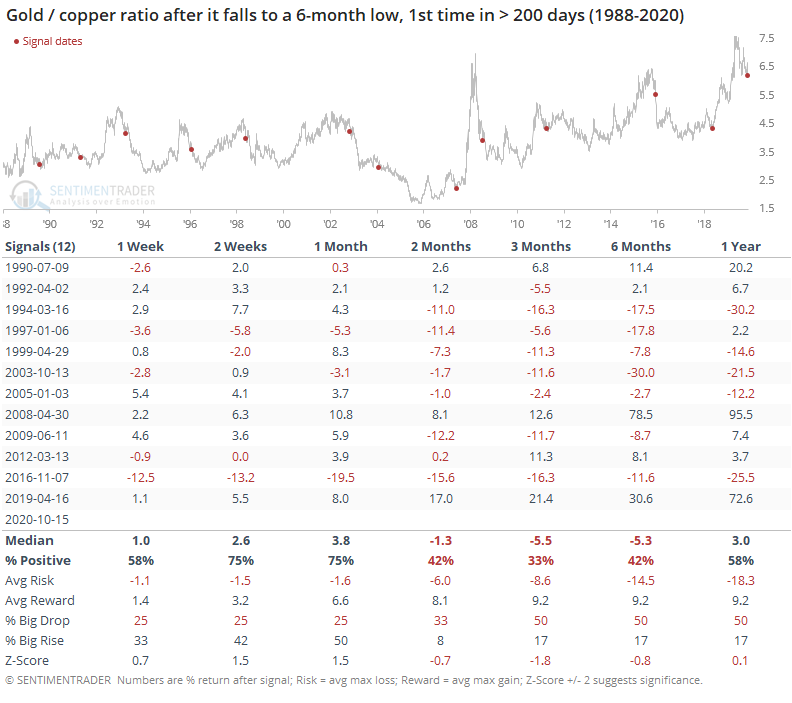
According to Bloomberg, the ratio of gold to copper has dropped to its lowest level in months, as traders shift from safety to growth. The last couple of times the ratio fell to a 6-month low for the first time in more than 200 sessions, stocks rallied hard in the months ahead.

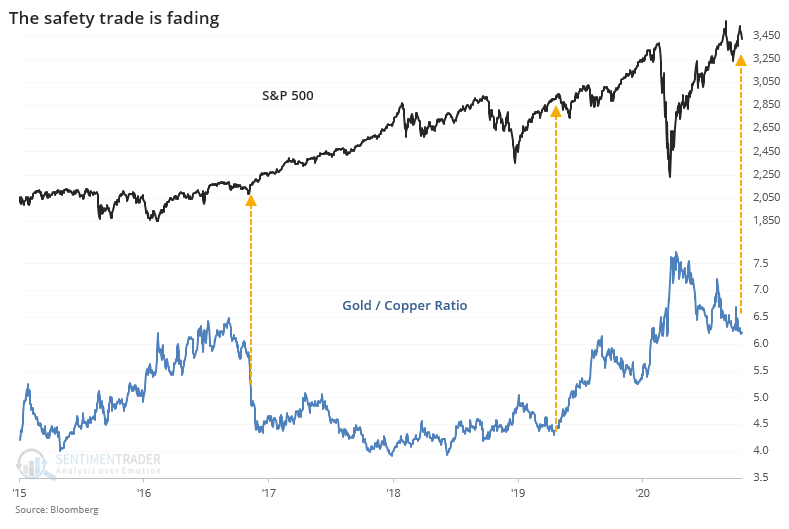
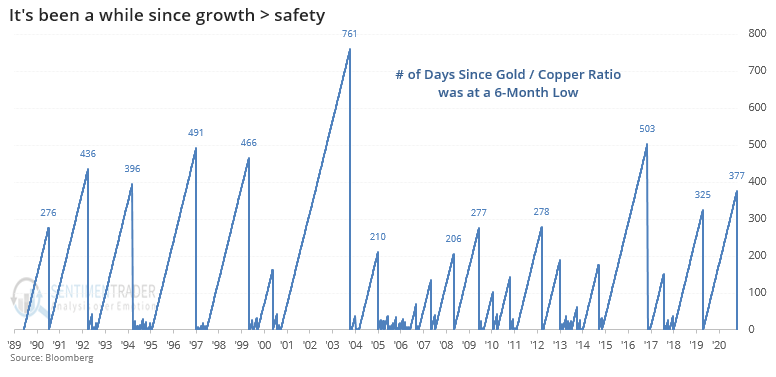
If we believe in the theory behind this ratio, then traders have been anxious for a while. The recent drop in the ratio marked the first time in nearly a year and a half that it had been at a 6-month low, one of the longest streaks in over 30 years.

Other times the ratio ended a long streak without a 6-month low, gold prices tended to keep falling.

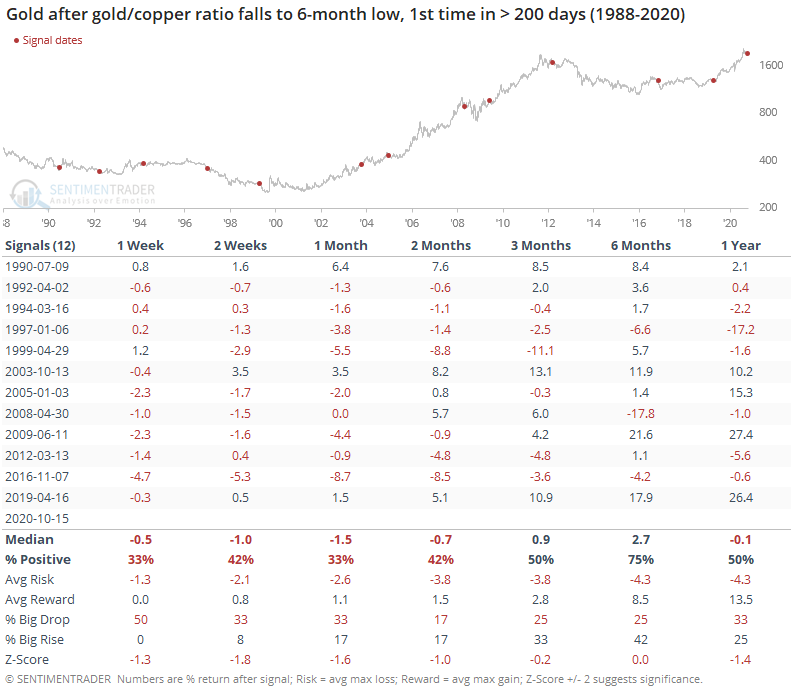
Over the short- to medium-term, gold struggled to show a gain. The win rate, average return, and risk/reward skew were all negative up to 2 months later. About the only solace for bulls was the 6-month window when it finally turned positive.

Copper also tended to struggle. Weakness here was mostly shorter-term, with an especially poor risk/reward ratio over the next month.

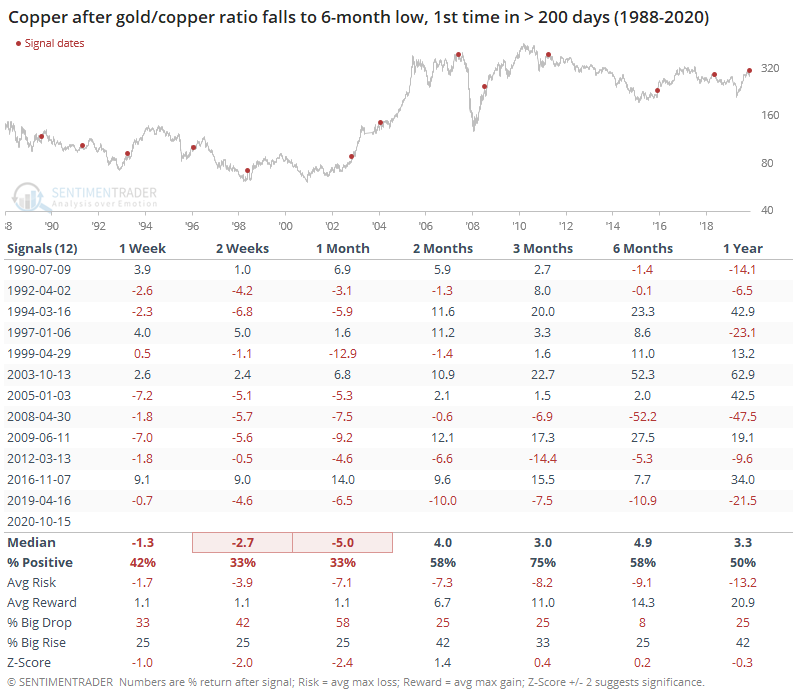
Even so, gold tended to drop more than copper over the medium-term, so the ratio between them continued to decline. The ratio rebounded about 3 times out of 4 during the next 2-4 weeks, but after that the longer-term trend asserted itself.

For other markets, it was a modestly good longer-term sign for stocks, not so much for the dollar or Treasuries over the medium-term.

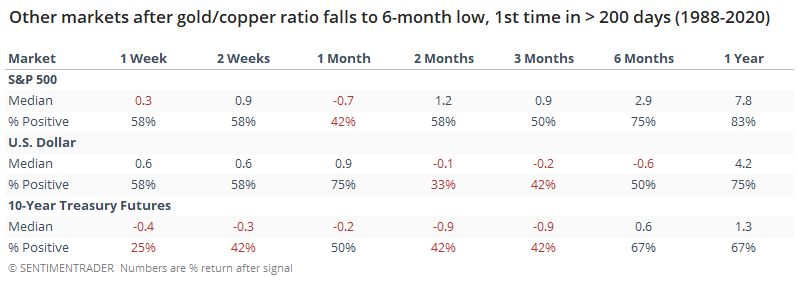
Over the next 6-12 months, the S&P 500 showed consistent gains, with a good average return, but nothing much beyond random. Shorter-term returns were even a bit below random, so assuming that this risk-on signal meant gains ahead for stocks wasn't very useful. It was modestly successful at preceding declines in T-notes over the next 2-3 months, meaning interest rates rose.

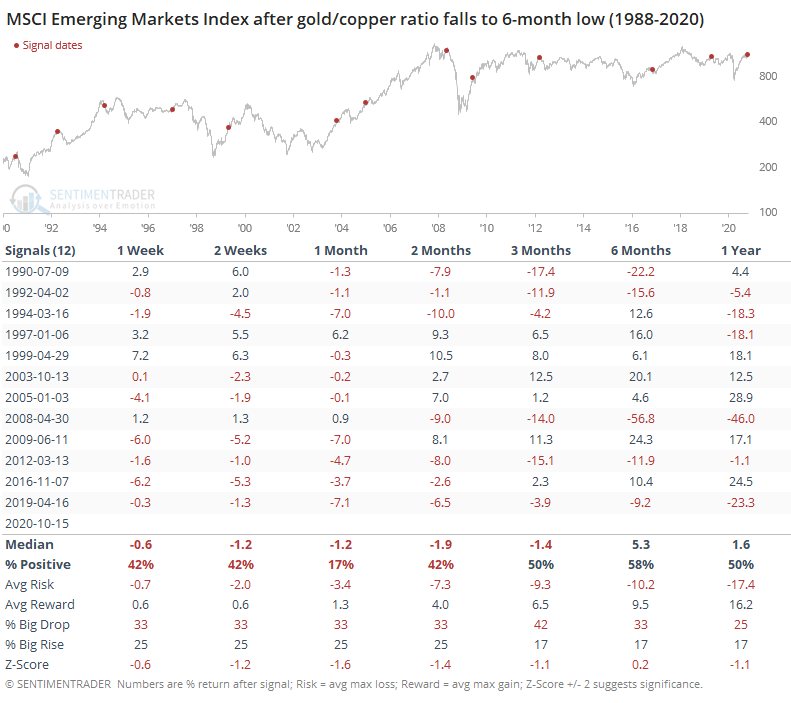
A breakout in copper is supposed to be a particularly good sign for emerging markets, but when the gold / copper ratio fell to a 6-month low, emerging markets had a strong tendency to show a loss over the next month, gradually working toward breakeven over the next several months.

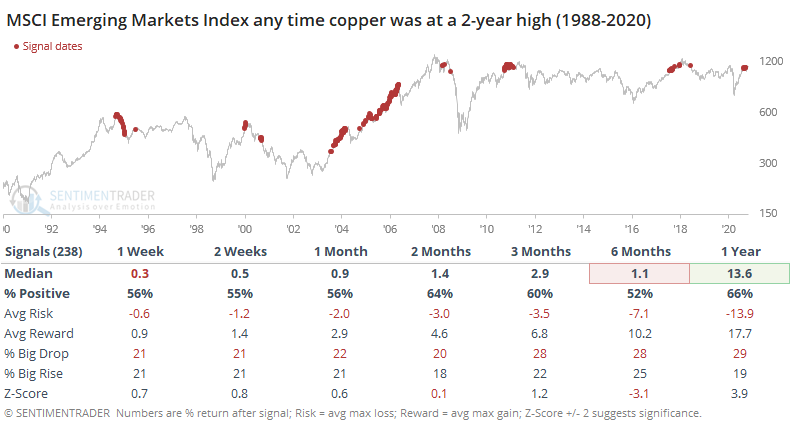
If we forget gold for a moment and just look at any day when copper hit a 2-year high, it was still not a consistent reason to buy emerging markets.

It should be a good sign that risk aversion is receding, but based on this ratio's measurement of it, not consistent enough to put a lot of weight behind.

Sorry, you don't have access to this report

Upgrade your subscription plan to get access
Go to Dasboard
DATA &
TECHnologies
IndicatorEdge
‍
BackTestEdge
‍
Other Tools
‍
DataEdge API
RESEARCH
reports
Research Solution
‍
Reports Library
‍
actionable
Strategies
Trading Strategies
‍
Smart Stock Scanner
‍
FREE
RESOUrCES
Simple Backtest
Calculator
Simple Seasonality
Calculator
The Kelly Criterion
Calculator
Sentiment Geo Map
‍
Public Research Reports
‍
Free Webinar
COMPANY
‍
About
‍
Meet our Team
‍
In the News
‍
Testimonials
‍
Client Success Stories
Pricing
Bundle pricing
‍
Announcements
‍
FAQ
© 2024 Sundial Capital Research Inc. All rights reserved.
Setsail Marketing
TermsPrivacyAffiliate Program
Risk Disclosure: Futures and forex trading contains substantial risk and is not for every investor. An investor could potentially lose all or more than the initial investment. Risk capital is money that can be lost without jeopardizing ones’ financial security or life style. Only risk capital should be used for trading and only those with sufficient risk capital should consider trading. Past performance is not necessarily indicative of future results.

Hypothetical Performance Disclosure: Hypothetical performance results have many inherent limitations, some of which are described below. No representation is being made that any account will or is likely to achieve profits or losses similar to those shown; in fact, there are frequently sharp differences between hypothetical performance results and the actual results subsequently achieved by any particular trading program. One of the limitations of hypothetical performance results is that they are generally prepared with the benefit of hindsight. In addition, hypothetical trading does not involve financial risk, and no hypothetical trading record can completely account for the impact of financial risk of actual trading. for example, the ability to withstand losses or to adhere to a particular trading program in spite of trading losses are material points which can also adversely affect actual trading results. There are numerous other factors related to the markets in general or to the implementation of any specific trading program which cannot be fully accounted for in the preparation of hypothetical performance results and all which can adversely affect trading results.

Testimonial Disclosure: Testimonials appearing on this website may not be representative of other clients or customers and is not a guarantee of future performance or success.