Products
SentimenTrader Trading Tools
‍
Backtest Engine
My Trading Toolkit
Correlation Analysis
Seasonality
Market Prediction
Indicators & Data API
‍
Proprietary Indicators & Charts
Market Data API
Strategies & Scanner
‍
50+ Trading Strategies
Smart Stock Scanner
Smart Option Scanner
Research Reports
‍
Research Solutions
Reports Library
Free Resources
Simple Backtest Calculator
Simple Seasonality Calculator
The Kelly Criterion Calculator
Sentiment Geo Map
Public Research Reports
Education
Sentiment Indicators
Technical Indicators
Pricing
Company
About
In the News
Testimonials
Client Success Stories
Contact
Log inLoginSign up
< BACK TO ALL REPORTS

The rare case of a dual pullback in stock and bond total returns

Jason Goepfert
2022-02-15
Both stocks and bonds have pulled back more than 5% from their 52-week highs. This is extremely unusual, happening only 6 other times in 46 years. After similar dual pullbacks, both markets rebounded strongly, with bonds showing the better risk / reward profile.

Key points:

  • Stock and bond total returns have pulled back at least 5% from their highs
  • This is only the 7th time since 1976 that both markets pulled back at the same time
  • After other dual pullbacks, both markets rebounded, bonds more strongly

A dual pullback in stocks and bonds

It's been a heckuva year for investors, and not in a good way. The overwhelming majority of investment wealth in the U.S. is tied to stocks and bonds, and both have been broadly hit. Neither asset class has provided ballast to the other.

We saw on Monday that high-yield bonds have suffered heavy selling over the past month, on par with some of the worst declines in 15 years. It's not just junk bonds that investors are selling, though. Investment-grade bonds, municipals, Treasuries - all have suffered.

This sell-everything mentality has created an unusual situation where both stocks and bonds are losing ground simultaneously.

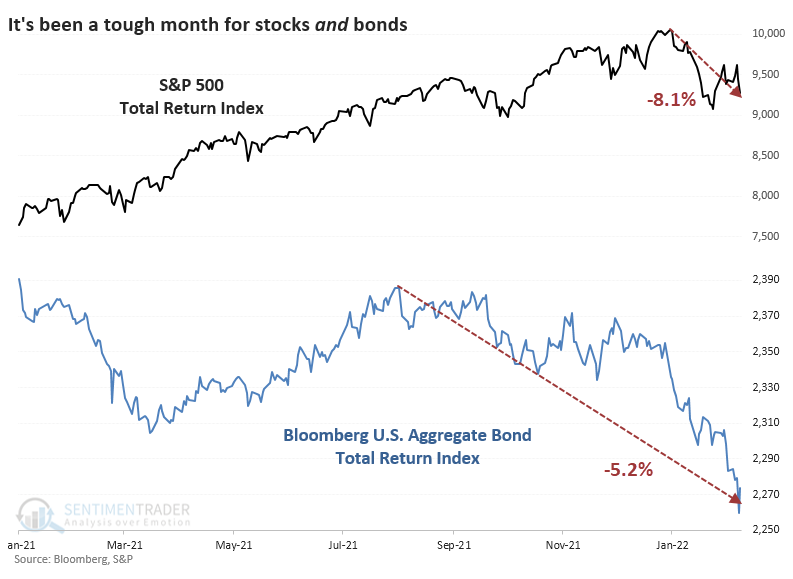
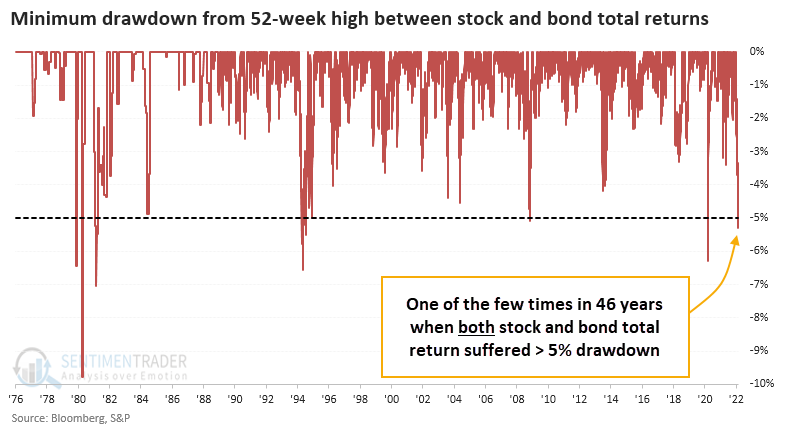
It's extremely rare to see both stocks and bonds in a pullback at the same time, defined as a 5% decline from a 52-week high. Starting late last week, the total return in the S&P 500 and Bloomberg U.S. Aggregate Bond Index were both more than 5% off their highs. Investors have endured a dual pullback only a handful of times in the past 46 years.

Dual pullbacks led to consistent rebounds, especially in bonds

These dual pullbacks were a good sign that whatever macro concerns were driving the selling was mostly overdone. The S&P did suffer some losses in the months ahead, especially in 2008 as the final bout of panic hit markets. But over the next year, there was only a single small loss, which was quickly and dramatically reversed.

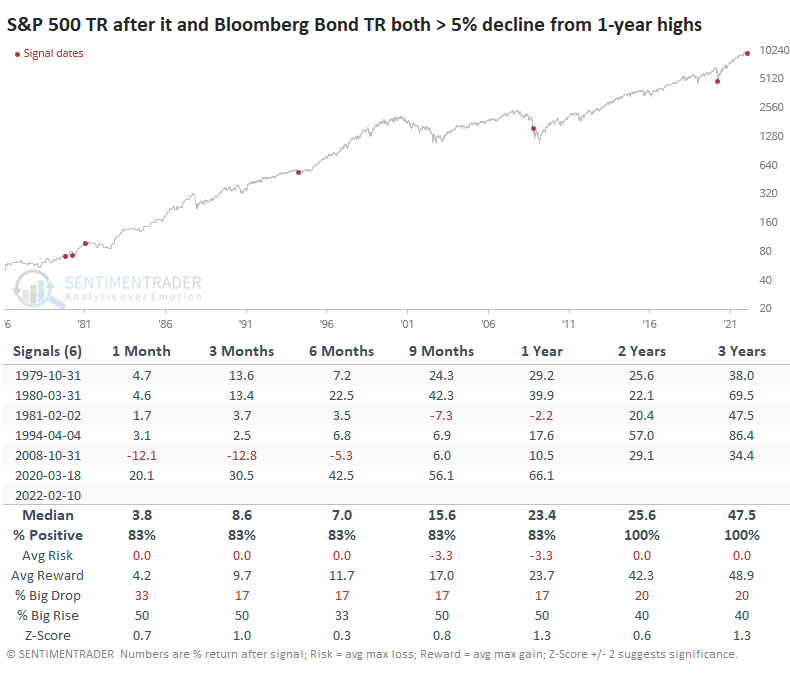
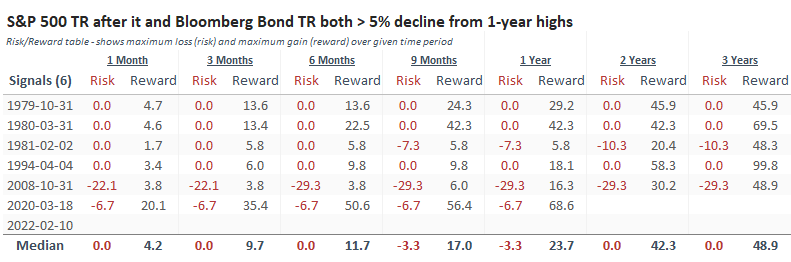
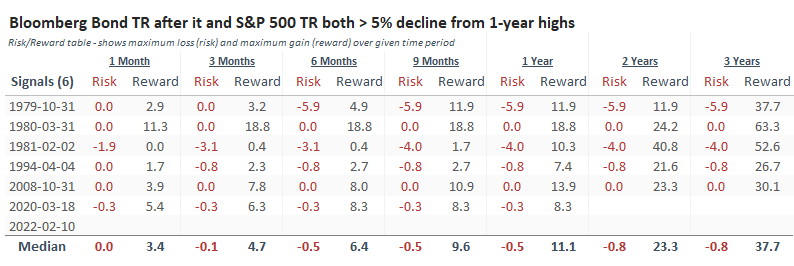
The Risk/Reward Table shows that except for 2008, the "risk" side of the equation was relatively limited, while "reward" was especially impressive after a year and beyond.

It's been mostly a tailwind for the bond market over the past 40+ years, so it's not a big surprise that the total return on the Bloomberg U.S. Bond Aggregate was mouth-watering. From 9 months and beyond, the Bloomberg Aggregate showed gains every time, well above random returns.

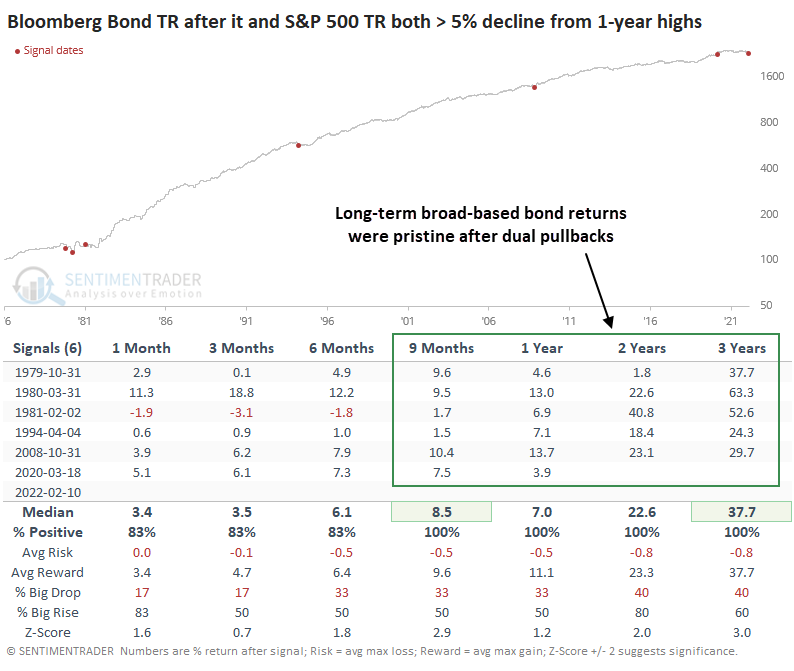
The Risk/Reward Table shows very little of the former and a whole lot of the latter. The sample size is tiny, but it's rare to see such a skewed ratio between losses and gains in any market.

What the research tells us...

The secular bull market in bonds will end at some point, and investors will have to deal with a multi-year, or multi-decade, rise in interest rates. It makes sense that we're on the cusp of that now, but there were convincing arguments that we were on the brink in 2010, and here we are more than a decade later. This is where reliance on history shows its shortcomings, but generally, we rely on investors to behave more or less in line with how they have in the past. In that sense, the dual pullback in stocks and bonds smacks of wholesale selling pressure that is due in part to emotional anxiety. After similar behavior, assets had a strong tendency to rebound, bonds most of all.

PRODUCTS
SentimenTrader
Trading Tools
Indicators & Data API
‍
Strategies & Scanner
‍
Research Reports
FREE
RESOUrCES
Simple Backtest
Calculator
Simple Seasonality
Calculator
The Kelly Criterion
Calculator
Sentiment Geo Map
‍
Public Research Reports
‍
Education
Sentiment Indicators
‍
Technical Indicators
‍
Pricing
Bundle pricing
‍
FAQ
‍
Announcements
‍
COMPANY
‍
About
‍
In the News
‍
Testimonials
‍
Client Success Stories
CONTACT
‍
General Inquiries
‍
Media Inquiries
‍
Financial Professionals Inquiries
‍
© 2026 Sundial Capital Research Inc. All rights reserved.
Setsail Marketing
TermsPrivacyAffiliate Program
Risk Disclosure: The information and tools provided are for research and analytical purposes only and are not intended as investment advice. Market analysis involves uncertainty, and outcomes may differ from expectations. Users should conduct their own due diligence and consider their individual circumstances before making any financial decisions. Past performance is not necessarily indicative of future results.

Hypothetical Performance Disclosure: Hypothetical performance results have many inherent limitations, some of which are described below. No representation is being made that any account will or is likely to achieve profits or losses similar to those shown; in fact, there are frequently sharp differences between hypothetical performance results and the actual results subsequently achieved by any particular trading program. One of the limitations of hypothetical performance results is that they are generally prepared with the benefit of hindsight. In addition, hypothetical trading does not involve financial risk, and no hypothetical trading record can completely account for the impact of financial risk of actual trading. for example, the ability to withstand losses or to adhere to a particular trading program in spite of trading losses are material points which can also adversely affect actual trading results. There are numerous other factors related to the markets in general or to the implementation of any specific trading program which cannot be fully accounted for in the preparation of hypothetical performance results and all which can adversely affect trading results.

Testimonial Disclosure: Testimonials appearing on this website may not be representative of other clients or customers and is not a guarantee of future performance or success.