The "Quick and Dirty" Hedge
Options offer three primary uses:
- The ability to speculate on market direction inexpensively
- The ability to generate income and/or profit from "neutral" situations
- The ability to hedge an existing position or portfolio
What we will discuss here is intended to fall into the third category - hedging a portfolio - but could also slip into the first category.
The person who first introduced me to the strategy discussed herein actually referred to it as the "Garbage Trade". The implication was "you risk a couple of bucks in case something unexpected happens." The expectation was NOT so much that you will make money per se. The expectation was that you may offset some part of losses on an existing portfolio at a relatively low cost.
The Quick and Dirty Hedge
- The example below - and the strategy as presented here - IS NOT "sophisticated portfolio hedging."
- In essence it is a crude attempt to save your backside, possibly based on nothing more than a hunch. In addition, there are any number of variations that a trader might employ.
- Each of the "rules" presented below is - in the immortal words of Bill Murray in Caddyshack - "more like a guideline"
- It should also be pointed out that the version of the Quick and Dirty Hedge as presented below IS NOT "Crash Insurance"
As you will see in the example, the goal is to hedge against a "normal" decline up to a point. The initial version is not a hedge against Armageddon.
The first thing that has to happen is that you "sense trouble." Clearly that can and will mean many different things to many different people and there is no way to quantify it. But for better or worse, there you have it. To illustrate the steps from here, let's consider a specific example. And as always, please remember that that is what this is - nothing more than an example.
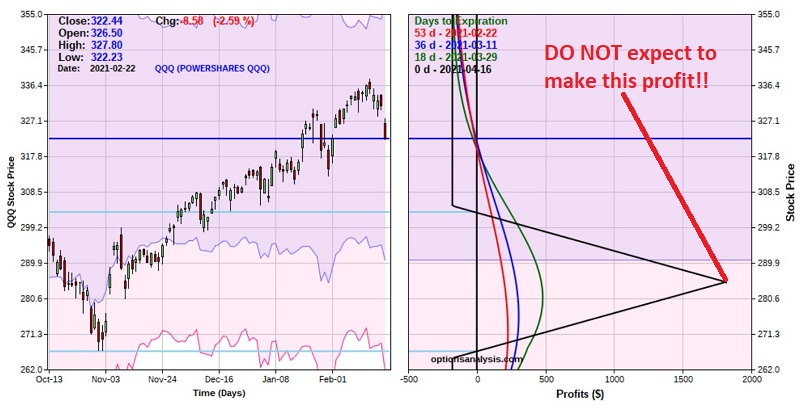
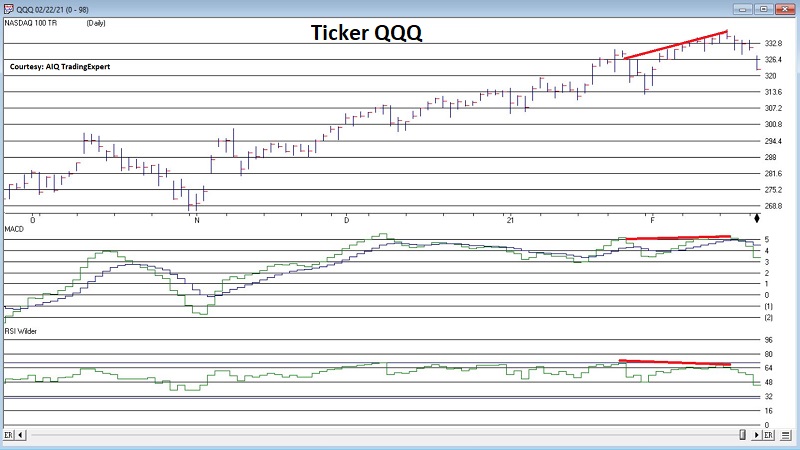
Let's say that late in the day on 2/22/21 a trader "got a bad feeling" about the stock market based on the weak action seen in ticker QQQ at the far right of the chart below.

The Guidelines
#1. As a general rule you want to go out at least 45 days in terms of option expiration.
This is not a rule. If you expect that trouble is imminent you can use shorter-term options. The basic tradeoff is this:
- The closer the expiration the more correct the timing of your hunch must be in order to avoid a loss
- The farther out the expiration, typically the more costly and less liquid the options
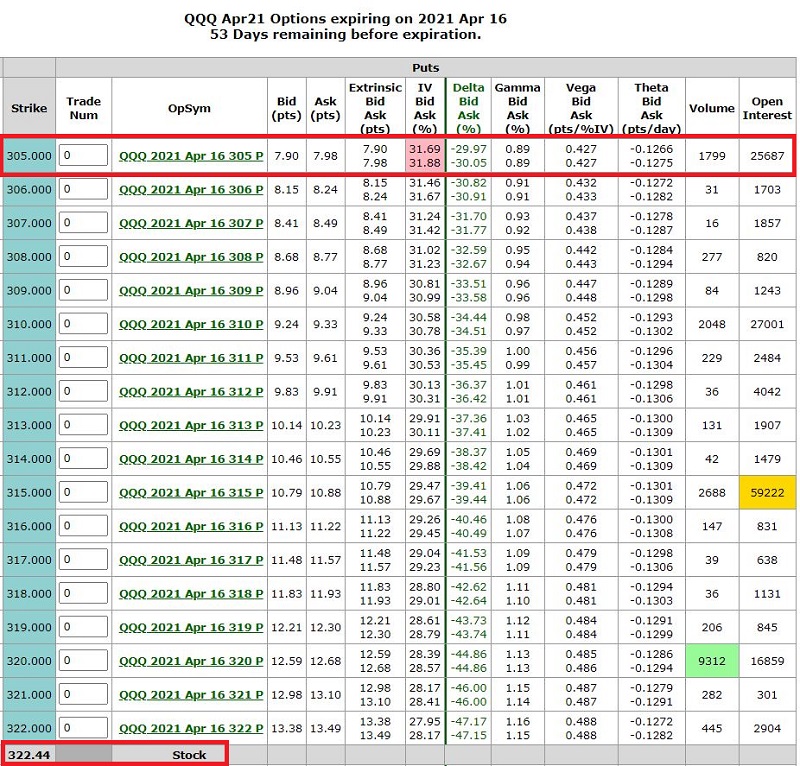
#2. Look to buy a put option roughly 5% out-of-the-money that has decent trading volume.
QQQ at the time was trading at 322.44. We will look at April options (which expire on 4/16) since they have 53 days left until expiration. The 306 strike is the first one 5% out-of-the-money. However, as you can see in the table below the 305 put has much higher volume and open interest.
- We will buy the Apr21 305 put (7.90 bid/7.98 ask)
(All Figure below are courtesy of www.OptionsAnalysis.com)
#3. Sell two of a lower strike put option to pay for the higher strike option we are buying.
Since we are paying roughly $7.94 for the 305 put then we need to sell two puts at a price of $3.92 or higher to pay for the 305 put. As you can see in the table below, we could go as far out as the 284 strike. But once again - with real-world trading in mind - we note that the 285 strike has significantly higher volume and open interest. 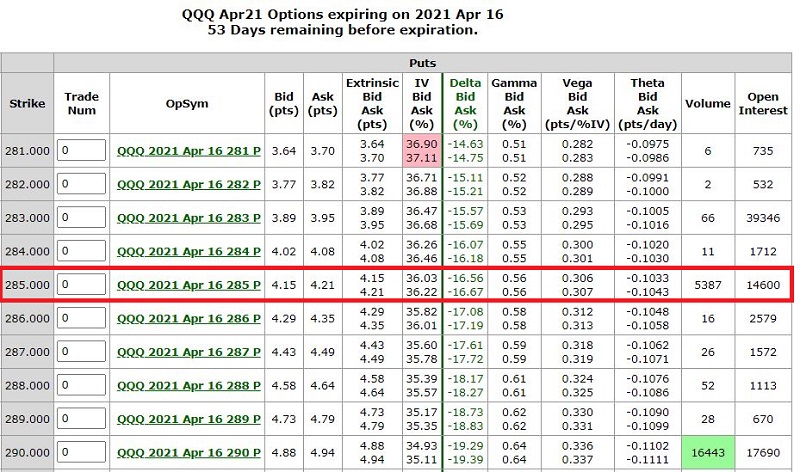
- We will sell 2 Apr21 285 puts (4.15 bid/4.21 ask)
#4. Note the difference between the two strike prices above (305-285 or 20 points in this example). Buy one more put at a strike that distance (or as close to it as possible) below the option sold.
We bought 1 305 put and sold 2 285 puts. So, to complete the trade we will buy 1 Apr21 265 put (which is 20 points below the option we sold).
- We will buy 1 Apr21 265 put (2.17 bid, 2.22 ask)
Entering the Trade
Ideally you would enter this order:
- All at once as a multi-legged trade
- At a limit price equal to the midpoint of the bid/ask spread for each option
Example:
- Buy 1 Apr21 QQQ 305 put
- Sell 2 Apr21 QQQ 285 puts
- Buy 1 Apr21 QQQ 256 put
- At a limit price of $1.78
The math:
- Buy 1 305 put at $7.94
- Sell 2 285 puts at $4.18
- Buy 1 265 put at $2.20
- = $1.78
If filled, then you will have entered a 1x2x1 put butterfly spread at a cost of $178.
What Do We Get for Our $178?
The figure below displays the particulars for the trade and the chart below that displays the risk curves. Risk curves display the expected return at a given price for QQQ as of a given date leading up option expiration.
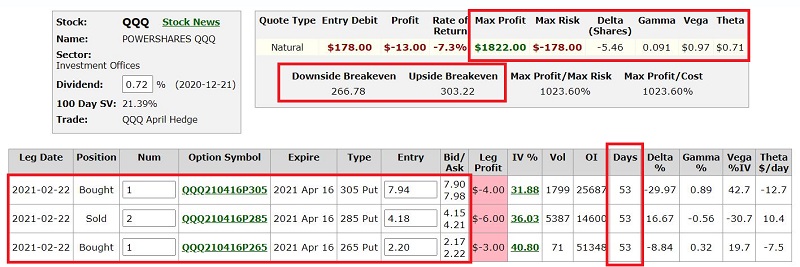
The thing that initially gets most people's attention is the fact that the trade costs only $178 to enter but has a maximum profit potential of $1,822 (see the peak of the black risk curve - which represents the expected $ gain/loss at expiration - in the chart below).
If that fact excites you then take what I say next as a cold, hard slap of reality. The bottom line is that QQQ would have to close at EXACTLY $285 a share on April 21st in order for the maximum profit to be realized. Sorry folks but - THAT'S NOT GOING TO HAPPEN!!!
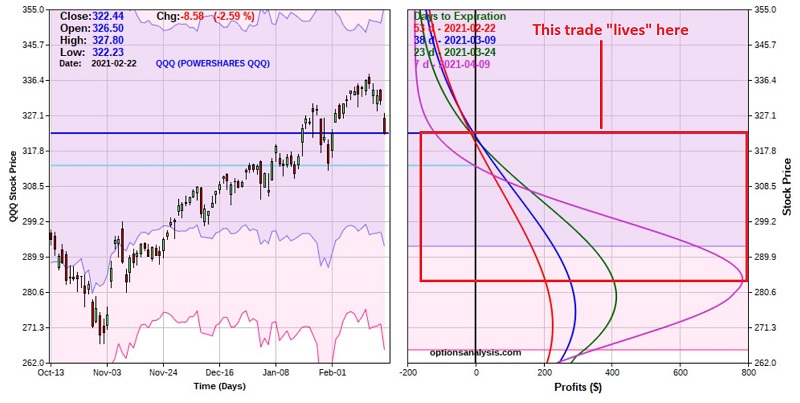
The play here IS NOT to hold on until expiration and hope for the maximum gain. The play here is to risk a small dollar amount in case QQQ falls down towards our short strike (285) SOMETIME between now and expiration. To get a better sense of "where this trade lives", let's redraw the risk curves so the last line is 7 days prior to expiration. See the chart below.
 The bottom line:
- If QQQ rallies from here or remains unchanged between now and April expiration, this trade will lose money.
- If QQQ declines between now and expiration this trade has the potential to generate a high percentage rate-of-return.
One technical note: this trade has positive "Theta". If price does decline into the profit zone the profit gets bigger with the passage of time (due to rapid time decay of the short 285 put option). To visualize this, note in the chart above that within the profit zone the profit gets bigger at a given price as time goes by, i.e., the blue line (3/9) is greater than the red line (2/22), the green line (3/24) is greater than the blue line (3/9) and the purple line (4/9) is greater than the green line (3/24). This is good news which means that we have time for this trade to play out.
The big question is "when to exit this trade?"
- The most important thing to note is that the risk curves "roll over" and begin to decline if price falls below $285 a share.
- Therefore, if QQQ shares do happen to decline toward $285 it is essential to exit or adjust the position.
- Another possibility is to monitor whatever "oversold" type indicators you might routinely follow. For example, if QQQ were to decline to say $295 and your indicators suggest the market is oversold at that point, then that might be a good time exit all or part of the trade to lock in some profit, or to adjust the position.
This is a "crude" trade, hence the name the "Quick and Dirty Hedge". If you are expecting a market "crash" this IS NOT the strategy to use (because the risk curves roll over below the strike price of the option sold). This is an inexpensive way to bet on a standard issue pullback in the market.
Nothing more, nothing less.


