
The QQQ liquidity premium indicator triggered a risk-on signal

Key points:
- The Nasdaq 100 liquidity premium indicator cycled from the upper end of its recent range to the lower end
- Similar shifts in this volume-based sentiment indicator produced a 100% win rate over the following year
- Despite bullish results a year later, relative performance tends to be uninspiring in the first three months
A sentiment gauge based on trading volume triggered a risk-on alert
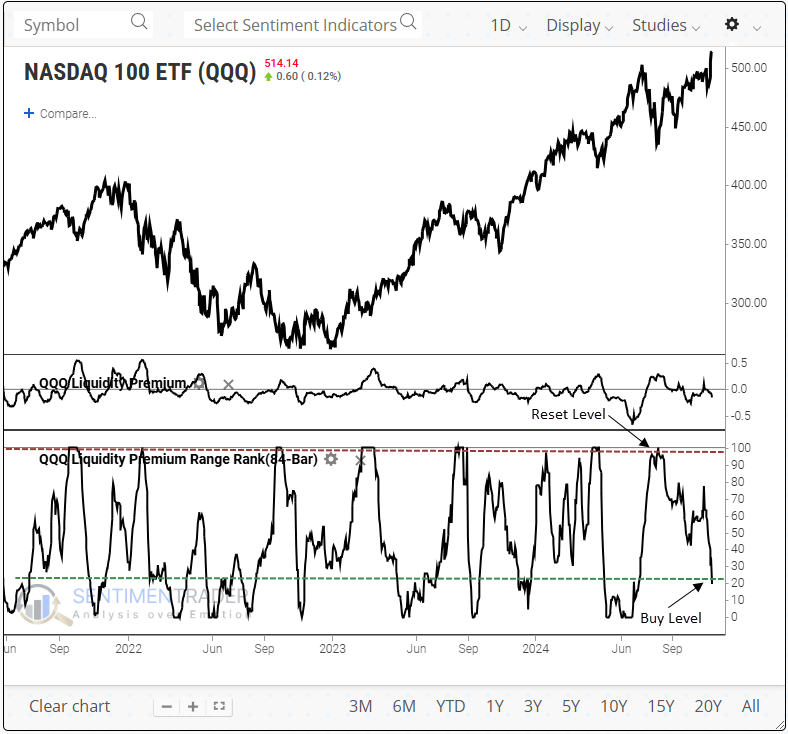
The Nasdaq 100 liquidity premium indicator compares the Nasdaq 100 ETF (QQQ) volume to that of the underlying stocks comprising the Nasdaq 100. When volume in the ETF increases relative to stocks, the indicator rises, indicating that investors are uncertain about the outlook for the market, a scenario typically associated with corrective phases. Eventually, confidence returns and volume increases in individual stocks compared to the ETF, causing the indicator to shift lower.
A trading model that utilizes the Nasdaq 100 liquidity premium indicator triggered a new risk-on signal, the first since 2019 when isolating precedents that occurred near a high, like now. Following that alert, the Nasdaq 100 gained 15% over three months.

The system generates a buy signal whenever the 84-day range rank for the QQQ liquidity premium indicator cycles from above 99% to under 24% and index momentum is positive.
Similar volume-based sentiment shifts preceded a bullish outlook
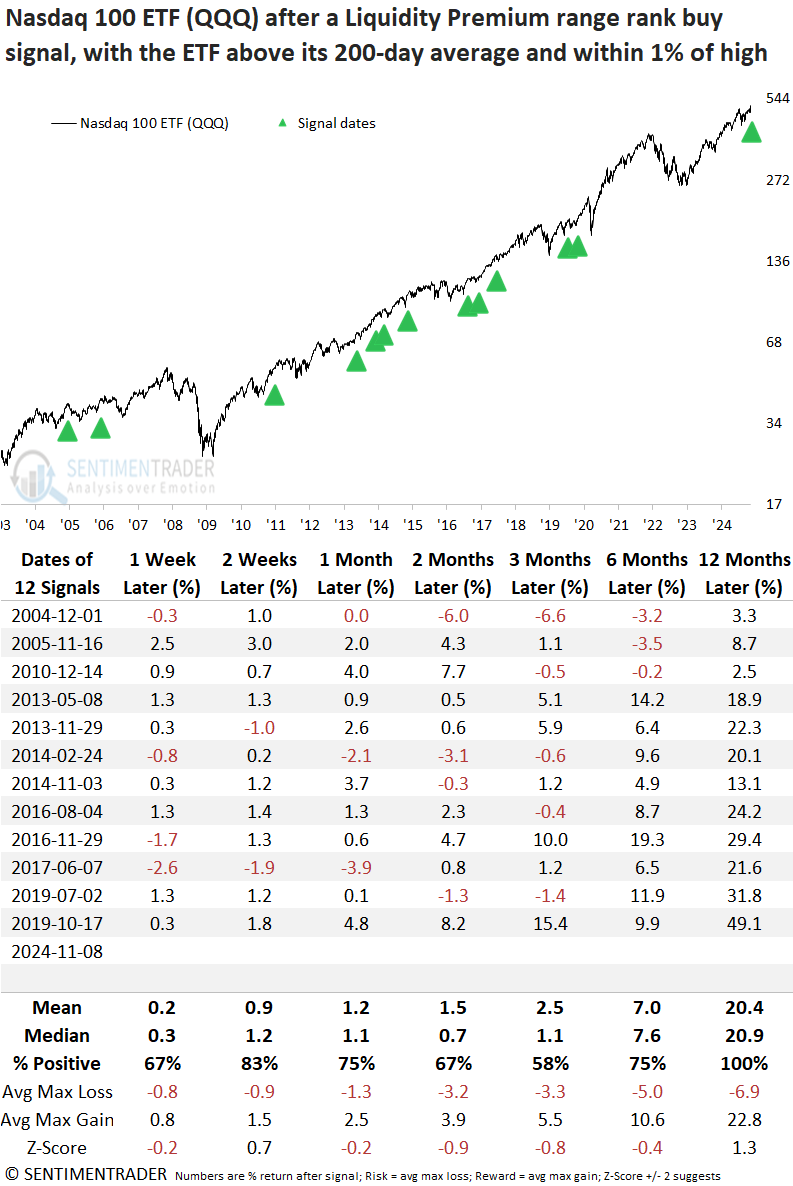
Whenever the QQQ liquidity premium indicator triggered a range-rank buy signal, with the ETF above its 200-day average, within 1% of a multi-year high, and exhibiting positive momentum, the Nasdaq 100 ETF (QQQ) rose 100% of the time over the subsequent year. Despite a highly favorable one-year outlook, the popular ETF tended to stall around the two-and three-month intervals before rallying again.
Relative trends are not ideal
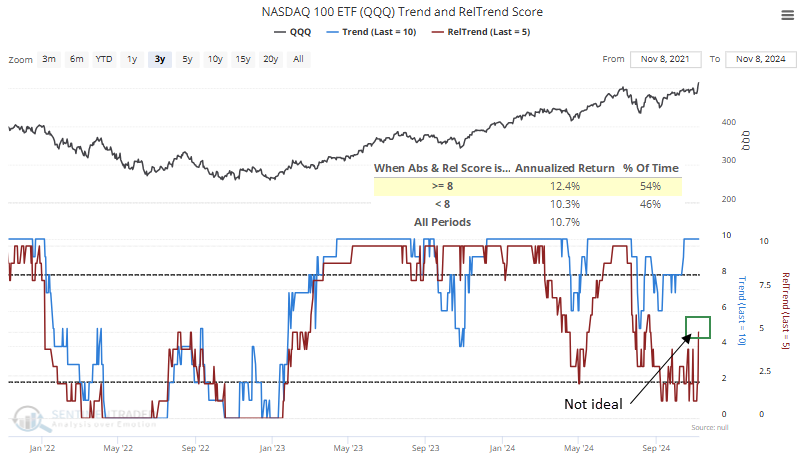
The relative trend composite for the Nasdaq 100 ETF (QQQ) displays a score of five, indicating that 5 out of 10 indicators maintain a favorable condition.
As illustrated in the following chart, when the absolute and relative trend score composites are eight or higher in unison, the ETF yields an
annualized return of 12.4%, outperforming returns when scores are lower and random returns over the study period.
Website subscribers can now utilize the trend score indicators in sortable tables, charts, and the backtest engine to generate trading and investing ideas.
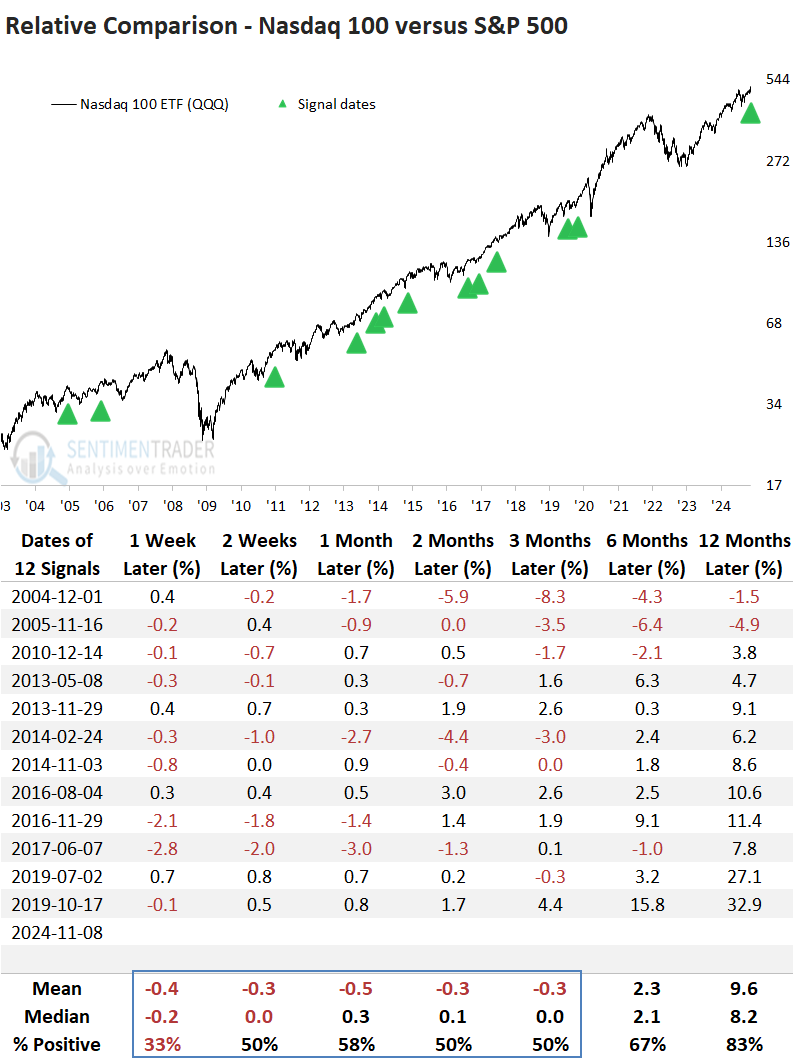
Since the current relative trend score for the QQQ ETF is not as favorable as the absolute trend score, comparing the Nasdaq 100 to the S&P 500 could shed light on the timing of a potential trade based on previous liquidity premium signals.
Over the first three months, the Nasdaq 100 showed no clear advantage over the S&P 500. However, in the subsequent year, it delivered notable outperformance. Therefore, waiting for the relative trend score to rise to eight or higher could provide a more favorable entry point.
What the research tells us...
The Nasdaq 100 liquidity premium indicator increased to an elevated level, indicating uncertainty or fear among investors. Subsequently, it reversed lower, triggering a risk on signal for the popular technology-oriented ETF. Similar shifts in this volume-derived sentiment indicator produced a 100% win rate for the Nasdaq 100 ETF (QQQ) over the subsequent year. However, current relative trends could be better, and the ETF typically underperforms the S&P 500 over a medium-term basis. Therefore, traders should be patient and wait for a better entry point, perhaps when the relative trend score increases above eight.