Data &
Technology
Research
Reports
Report Solutions
Reports Library
Actionable
Strategies
Free
Resources
Simple Backtest Calculator
Simple Seasonality Calculator
The Kelly Criterion Calculator
Sentiment Geo Map
Public Research Reports
Free Webinar
Pricing
Company
About
Meet Our Team
In the News
Testimonials
Client Success Stories
Contact
Log inLoginSign up
< BACK TO ALL REPORTS

The Probability of a New Bear Market is Rising

Jason Goepfert
2021-06-08
According to the Bear Market Probability model, the chances of a 20% decline in the year ahead is rising.

BEAR SIGHTING?

The probability of a new bear market is rising. 

Now that data from May have been finalized, the Bear Market Probability model has risen to its highest level since January 2020. 

Bear market probability model

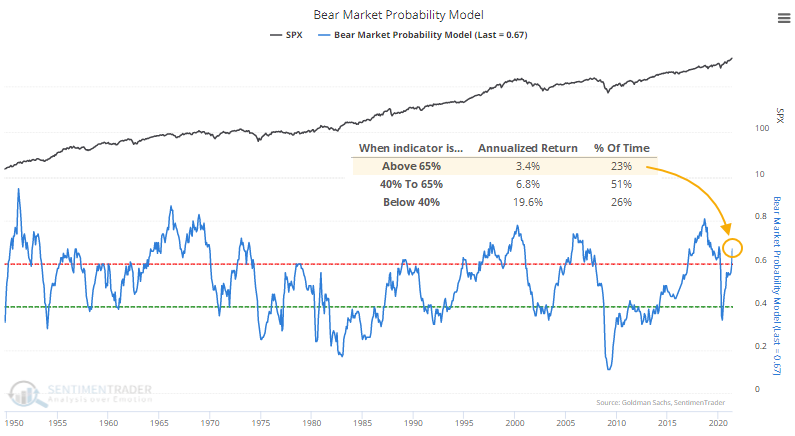
When the model is above this threshold, the S&P 500 has returned an annualized +3.4%. That's not disastrous, but it's well below average and only a sixth of the return when the probability is below 40%.

Bear Market Probability is our version of a model outlined by Goldman Sachs using five fundamental inputs. Each month's reading is ranked versus all other historical readings and assigned a score. The higher the score, the higher the probability of a bear market in the months ahead.

When we looked at this last March, we saw that it would plunge below 40%. While it was way too early in 2008, the other signals all preceded gains, and it added another win over the past year.

The past year is the fastest that Bear Market Probability has cycled from one extreme to the other. 

WHAT ELSE WE'RE DISCUSSING

  • Full details following a cycle in Bear Market Probability from below 40% to above 65%
  • An update on industry, sector, and country ETF relative and absolute trends
  • Taking a look at Real Estate, Oil & Gas, and Brazil ETFs with their trends
  • What happens when there is a drop in the % of sectors in bear markets


STAT BOX
With the excitement over Biogen (BIIB) and its Alzheimer's drug, traders plowed more than $350 million into the largest ETF for the biotechnology sector, IBB. According to our Backtest Engine, there have been 7 other days in the past decade with that large of an inflow. The average return for IBB over the next month was -0.3%.

FOR YOUR CONSIDERATION

Drained...

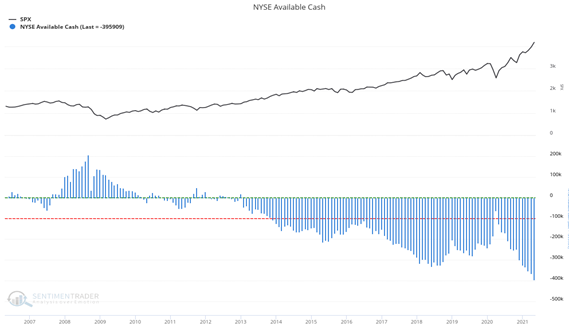
Available cash among brokerage accounts monitored by the NYSE is below $400 million for the first time in history. This subtracts free credits (cash) from margin debt.

Rise and fall...

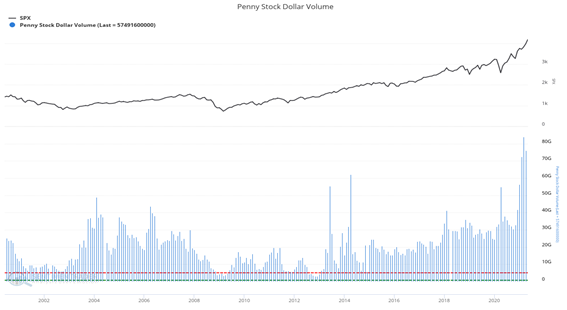
Penny stock shares and transactions reached their highest volume since mid-2006 last in February, then subsequently dropped 40%. Dollar volumes also pushed to their highest point in a decade, afterward losing 26 billion over the course of two months. It picked up a bit in May but remained well below peak.

Need. More. Money...

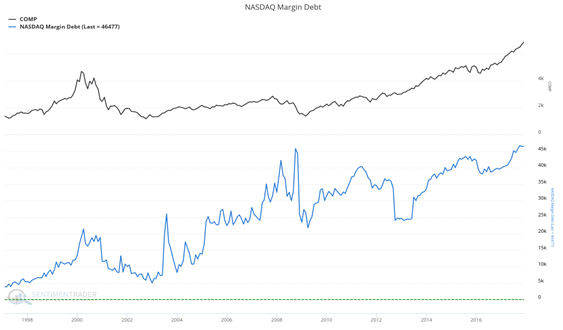
NASDAQ margin debt recently peaked at $46 billion, surpassing its previous high set in the fall of 2008. Investors are borrowing heavily in the U.S. (and elsewhere).

DATA &
TECHnologies
IndicatorEdge
‍
BackTestEdge
‍
Other Tools
‍
DataEdge API
RESEARCH
reports
Research Solution
‍
Reports Library
‍
actionable
Strategies
Trading Strategies
‍
Smart Stock Scanner
‍
FREE
RESOUrCES
Simple Backtest
Calculator
Simple Seasonality
Calculator
The Kelly Criterion
Calculator
Sentiment Geo Map
‍
Public Research Reports
‍
Free Webinar
COMPANY
‍
About
‍
Meet our Team
‍
In the News
‍
Testimonials
‍
Client Success Stories
Pricing
Bundle pricing
‍
Announcements
‍
FAQ
© 2024 Sundial Capital Research Inc. All rights reserved.
Setsail Marketing
TermsPrivacyAffiliate Program
Risk Disclosure: Futures and forex trading contains substantial risk and is not for every investor. An investor could potentially lose all or more than the initial investment. Risk capital is money that can be lost without jeopardizing ones’ financial security or life style. Only risk capital should be used for trading and only those with sufficient risk capital should consider trading. Past performance is not necessarily indicative of future results.

Hypothetical Performance Disclosure: Hypothetical performance results have many inherent limitations, some of which are described below. No representation is being made that any account will or is likely to achieve profits or losses similar to those shown; in fact, there are frequently sharp differences between hypothetical performance results and the actual results subsequently achieved by any particular trading program. One of the limitations of hypothetical performance results is that they are generally prepared with the benefit of hindsight. In addition, hypothetical trading does not involve financial risk, and no hypothetical trading record can completely account for the impact of financial risk of actual trading. for example, the ability to withstand losses or to adhere to a particular trading program in spite of trading losses are material points which can also adversely affect actual trading results. There are numerous other factors related to the markets in general or to the implementation of any specific trading program which cannot be fully accounted for in the preparation of hypothetical performance results and all which can adversely affect trading results.

Testimonial Disclosure: Testimonials appearing on this website may not be representative of other clients or customers and is not a guarantee of future performance or success.