
The probability of a new bear market is rising, but...

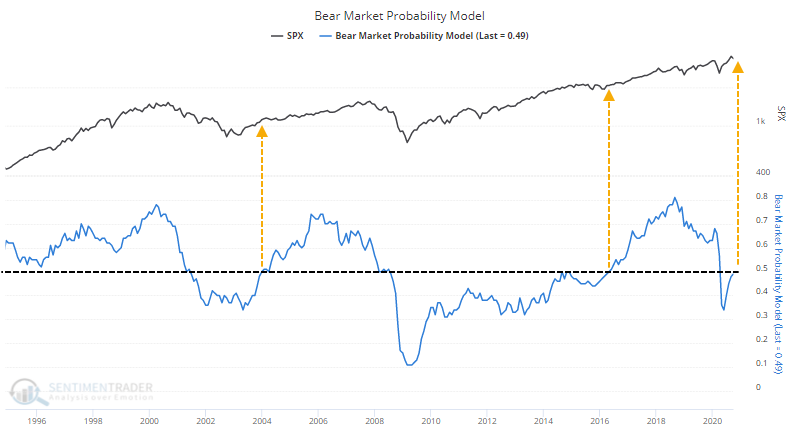
For the first time in half a year, there is more than a 50% probability that stocks will fall into a bear market in the coming months.
The Bear Market Probability Model climbed to a 50-year high in August 2018, then plunged to a 7-year low by May of this year. This is a model outlined by Goldman Sachs using five inputs covering fundamental, valuation, and price-based metrics:
- U.S. Unemployment rate
- ISM Manufacturing Index
- Yield Curve
- Inflation Rate
- P/E Ratio
Each month's reading is ranked versus all other historical readings and assigned a score. The higher the score, the higher the probability of a bear market in the months ahead. As outlined in a report from September 5, 2018, when the model was between 20% - 29%, the S&P's average one-year return was +21%. But when the model was 80% - 89%, that average return plunged to -2%. So the higher the model, the greater the chance for a bear market, or at least negative forward returns.
The model will drop as conditions deteriorate until it reaches a trough during bear markets (usually). It will rise as conditions improve. This seems counter-intuitive, but a rising probability of a bear market tends to be a good thing, until it reaches a very high level.
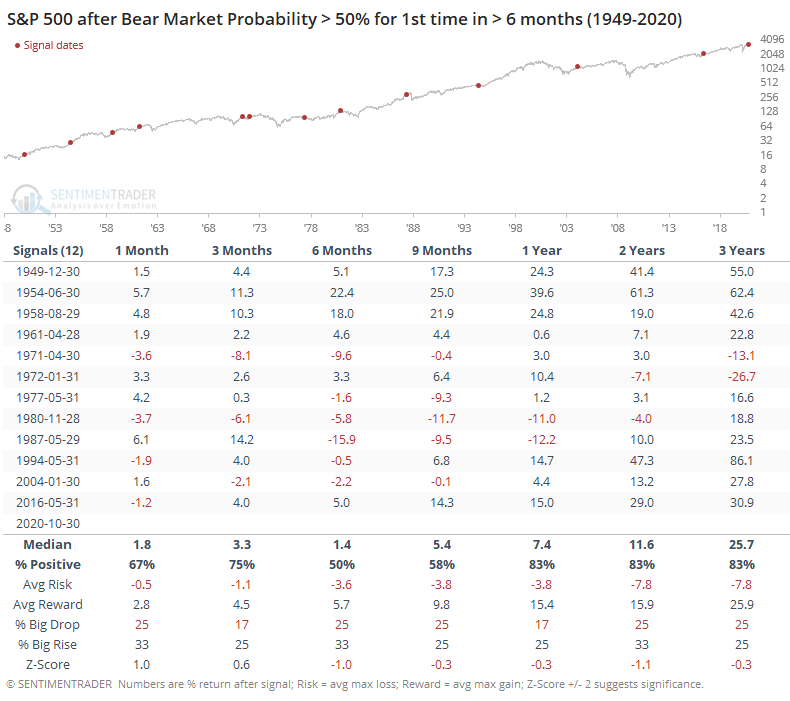
When the model had been below 50% for at least 6 months and then recovered, forward returns were mostly positive. Over the next 1-3 years, 10 of the 12 signals sported a positive return, though the average returns weren't very impressive.
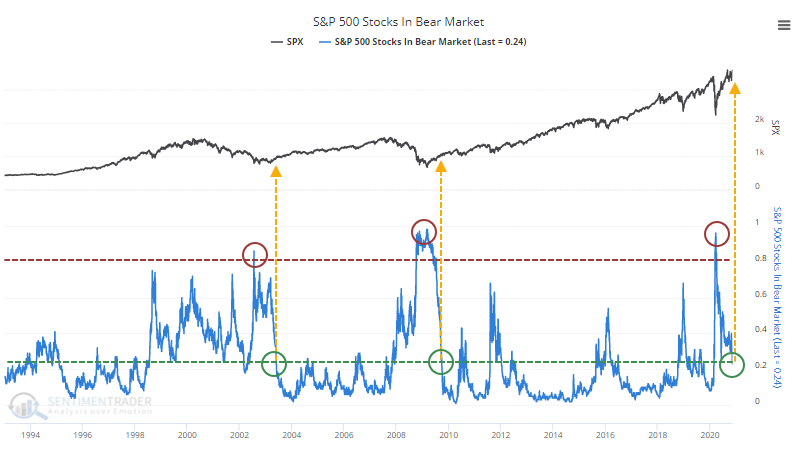
Because the Bear Market Probability tends to rise as markets recover, it typically goes inverse to the percentage of stocks themselves that are currently in bear markets. The more stocks that are already in a bear market, the lower the probability that more of them will fall into one going forward. It's kind of a mind-twister.
We certainly see that now with fewer and fewer stocks in the S&P 500 that are more than 20% off their highs. In March, more than 95% of stocks were in bear markets; now that is dropping close to 20% of stocks. The only other times that happened marked the end of the last two protracted bear markets.
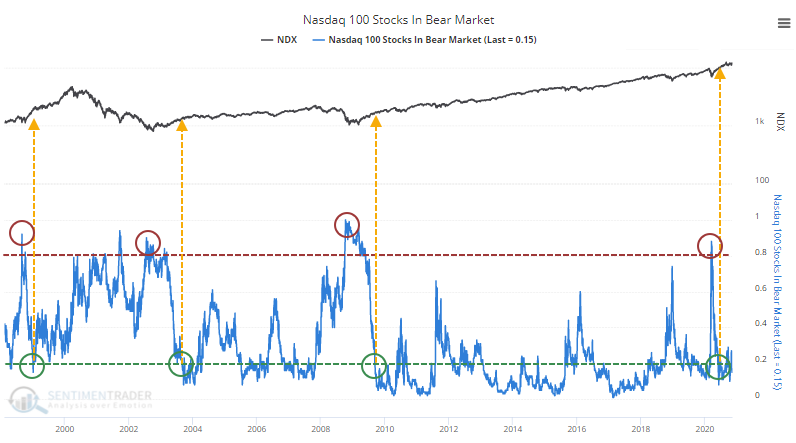
Same goes for the Nasdaq 100, with the added signal in 1998-99.
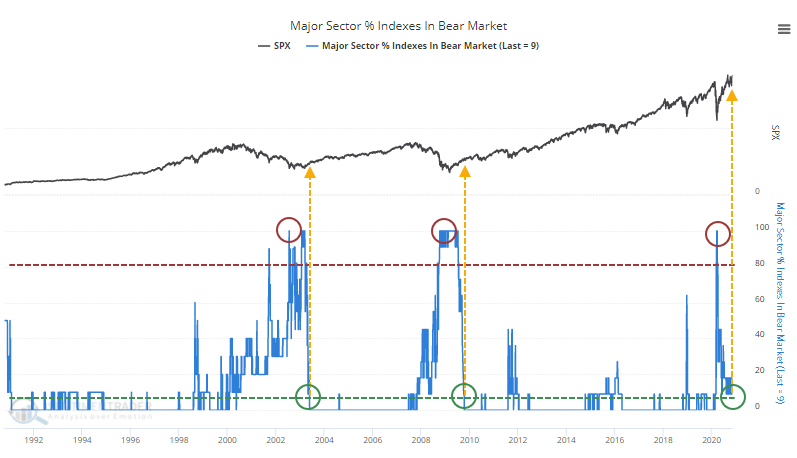
Not surprisingly, the percentage of sectors in bear markets followed the same pattern as the broader market.
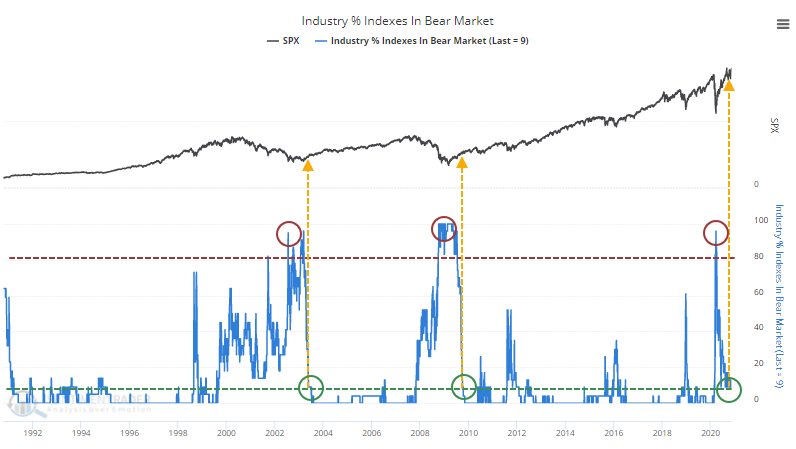
As well as the more granular industry data.
Perhaps more importantly, this has been a worldwide recovery, with a massive shift in major global indexes from being in bear markets to not.
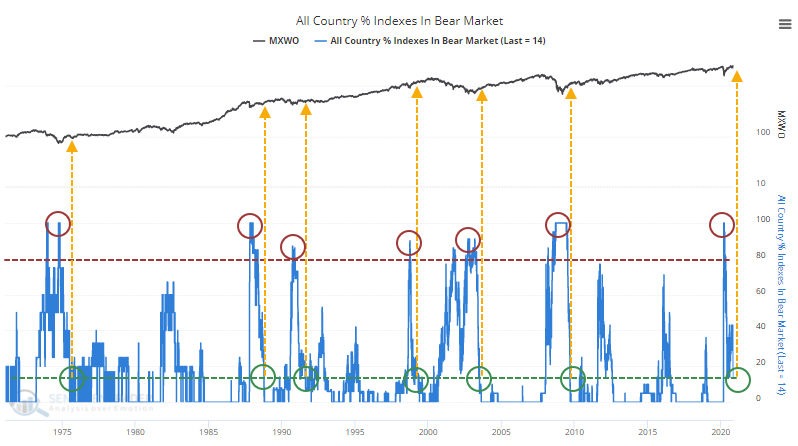
This actually triggered in June when the percentage of indexes in bear markets cycled from more than 80% of them to fewer than 15%. After rising a bit into October, it has since retreated to below 15% again.
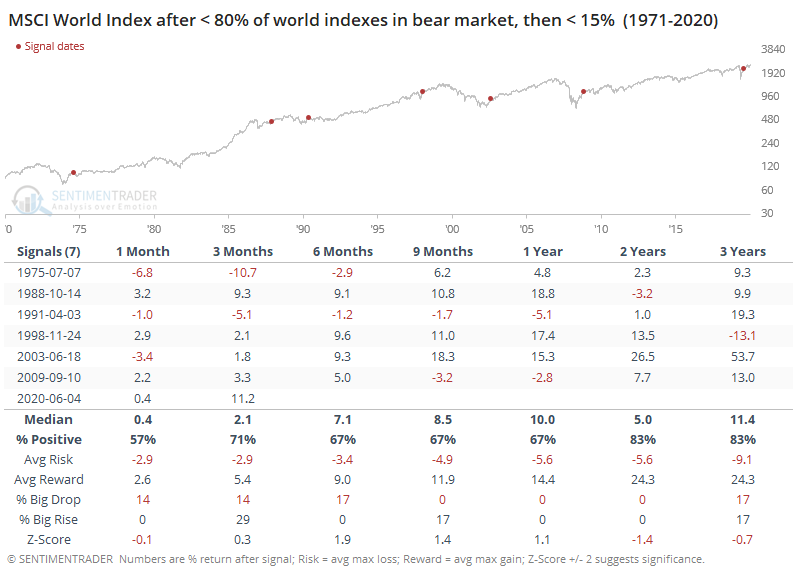
Over a longer time frame, forward returns in the MSCI World Index were fairly positive, with the most impressive part being the risk/reward ratio. There were some declines, but losses were muted relative to the recoveries that continued in the year(s) ahead.
The improvement in stocks, and some of the inputs driving them, should be a continued positive over the longer-term, given the losses they showed in March.