The Probability of a New Bear Market is Rising

Even as the major equity indexes vacillate near record highs, macro conditions are deteriorating and the probability of trouble is rising.
Economic reports have been coming in below economists' expectations, both domestically and globally. As another reflection of those weak reports, our Macro Index Model has been deteriorating.
The U.S. stock market and U.S. economy move in the same direction in the long term. Macro deteriorates from time to time, which is normal during the ebb and flow of an economic expansion. To differentiate temporary slowdowns from real problems, we look for significant macro deterioration. The Macro Index Model combines 11 diverse indicators to determine the state of the U.S. economy.
Once the final reports were in for August, the model plunged below 46%, the 2nd-lowest reading of the past decade.
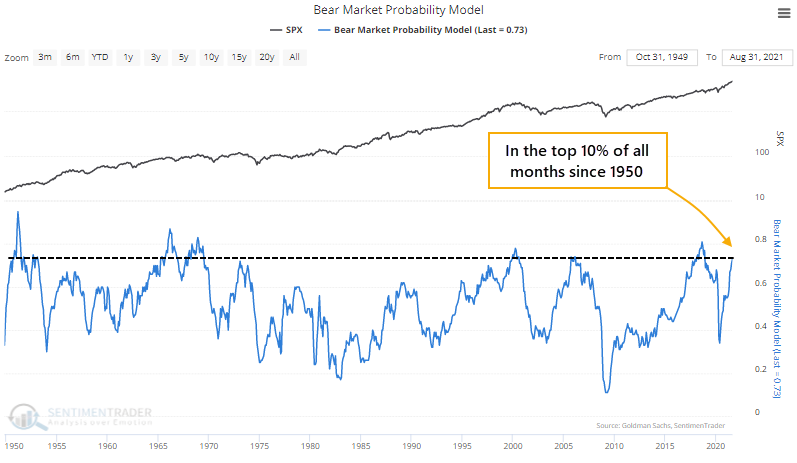
At the same time, the Bear Market Probability Model has jumped again. This is a model outlined by Goldman Sachs using five fundamental inputs. Each month's reading is ranked versus all other historical readings and assigned a score. The higher the score, the higher the probability of a bear market in the months ahead.
Last May, the model was in the bottom 10% of all months since 1950. This month, it jumped into the top 10% of all months.
There is some overlap between the two models, with a correlation of +0.25 (out of a scale from -1.0 to +1.0) since 1968. However, it's still rare to see both of them at such extremes at the same time.
When we combined the two models, the current conditions are the most extreme since 2007. Going back more than 50 years, forward stock returns under similar conditions were horrid.
There is no good way to square this kind of outlook against some of the positives that have been triggered lately, most notably the breadth thrusts. The biggest risk for those counting on the thrusts is that when they occur when the indexes are trading at new highs instead of after a protracted decline, they have sometimes highlighted blow-off peaks. 
What else we're looking at
- Full details on S&P 500 returns following extremes in the Bear Market Probability and Macro Index Model spread
- What sectors and factors did best and worst following those extremes
- Why we should watch wheat futures for the next few weeks
- A "deviation from trend" thrust in the Nikkei
| Stat box The S&P 500 fund, SPY, suffered its fourth consecutive down day for only the 3rd time since November 2020. The other two saw the fund immediately turn higher, so traders will be watching for a potential change in character. |
Etcetera
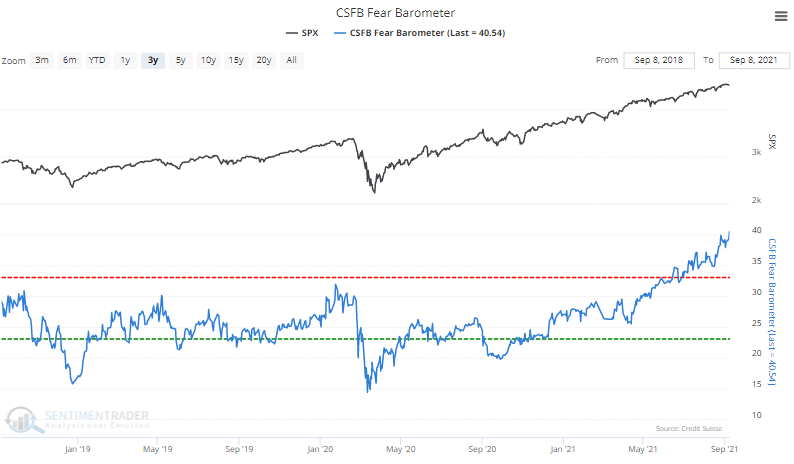
Fear protection. A trader in S&P 500 options would have to go 40% out of the money to buy a put with the proceeds of selling a call that is only 10% out of the money. This is a sign of extreme hedging demand, the highest in several years.
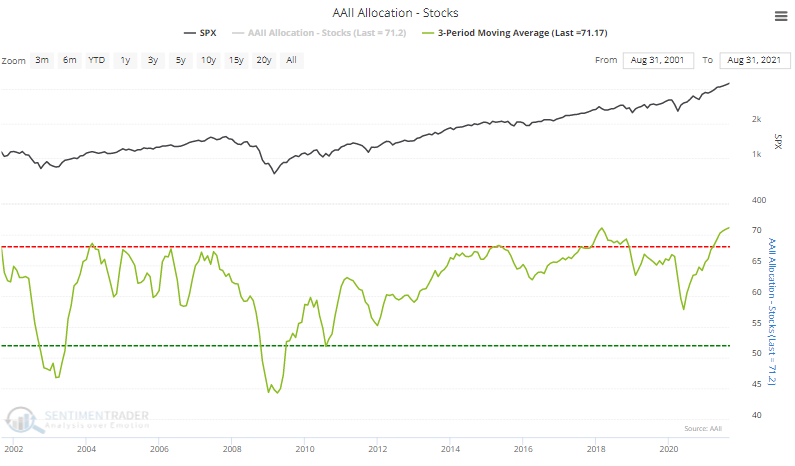
Heavy exposure. According to AAII, individual investors have had an average of more than 71% of their portfolios allocated to stocks over the past 3 months. That's the highest amount in more than 20 years.
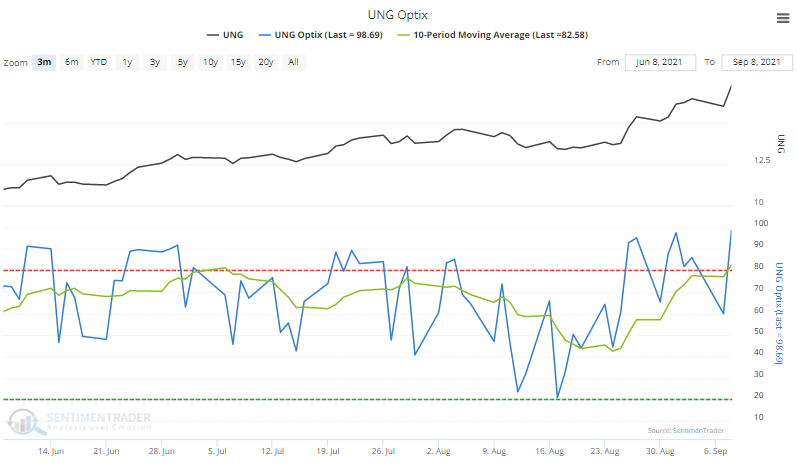
Gassed. On our Optimism Index Exhaustion Screen, the only fund that shows up is the UNG Natural Gas fund. It shows a spike in optimism on a daily basis when the 10-day average is already extreme.