Data &
Technology
Research
Reports
Report Solutions
Reports Library
Actionable
Strategies
Free
Resources
Simple Backtest Calculator
Simple Seasonality Calculator
The Kelly Criterion Calculator
Sentiment Geo Map
Public Research Reports
Free Webinar
Pricing
Company
About
Meet Our Team
In the News
Testimonials
Client Success Stories
Contact
Log inLoginSign up
< BACK TO ALL REPORTS

The Probability of a Bear Market is Rising

Jason Goepfert
2021-06-07
The Bear Market Probability model has cycled from below 40% to above 65% in only 11 months, the fastest turnaround ever. It's not high enough to be a pressing concern though future returns decline the higher the model climbs.

The probability of a new bear market is rising. 

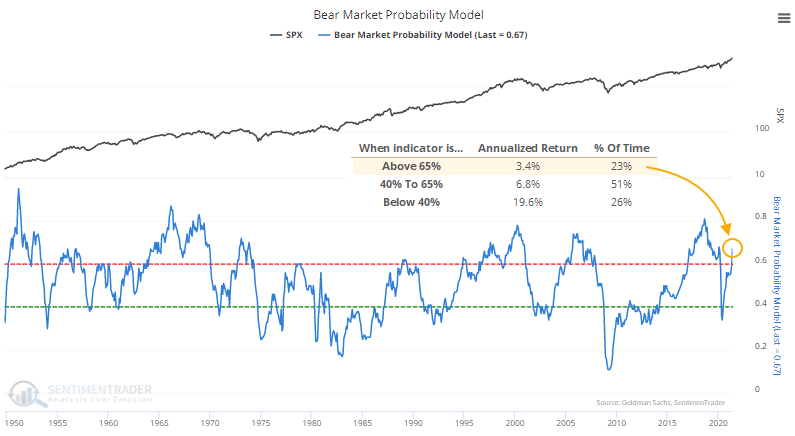
Now that data from May have been finalized, the Bear Market Probability model has risen to its highest level since January 2020. 

When the model is above this threshold, the S&P 500 has returned an annualized +3.4%. That's not disastrous, but it's well below average and only a sixth of the return when the probability is below 40%. Jay showed earlier that when it drops even further, below 35%, stocks gained almost without exception.

HOW IT'S CONSTRUCTED

Bear Market Probability is a model outlined by Goldman Sachs using five fundamental inputs:

  1. The U.S. Unemployment Rate
  2. ISM Manufacturing Index
  3. Yield Curve
  4. Inflation Rate
  5. P/E Ratio

Each month's reading is ranked versus all other historical readings and assigned a score. The higher the score, the higher the probability of a bear market in the months ahead.

WHAT IT MEANS FOR FUTURE RETURNS

When we looked at this last March, we saw that it was going to plunge below 40%. While it was way too early in 2008, the other signals all preceded gains, and it added another win over the past year.

Let's look at the S&P's future returns when the probability cycles from low to high, from below 40% to above 65%.

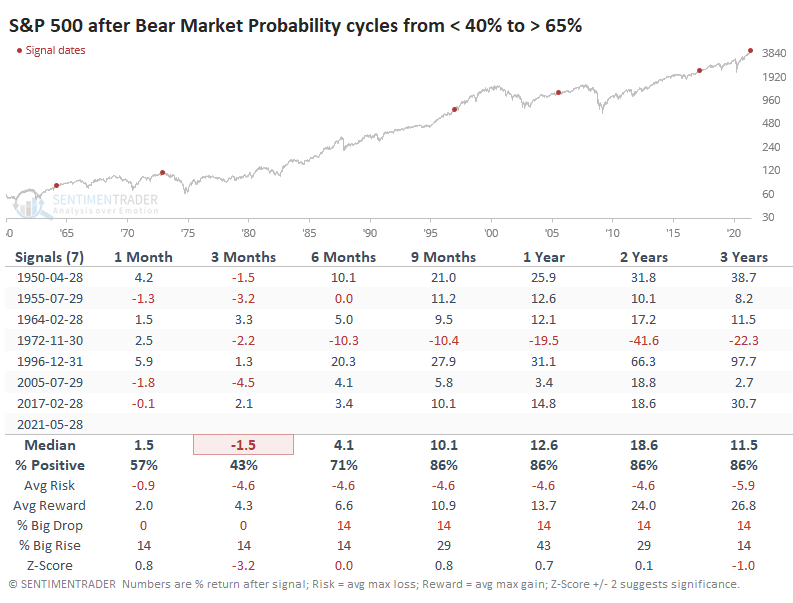
It took Bear Market Probability an average of 28 months to cycle from below 40% to above 65%.

Last year showed us one of the fastest-ever bear markets, then one of the quickest bull markets. So, it's not a big surprise that our current cycle took only 11 months, the shortest one ever. The previous shortest cycle was the one in November 1972 (a cycle of 12 months), which also preceded the biggest failure going forward, for what that's worth.

There isn't a lot in the table above that's concerning. Shorter-term returns were weak, but a couple of them within an already tiny sample bucked that weakness and saw consistent strength. Over the next year, all but two record double-digit gains. It will be a more pressing concern if Bear Market Probability climbs above 70%.

Sorry, you don't have access to this report

Upgrade your subscription plan to get access
Go to Dasboard
DATA &
TECHnologies
IndicatorEdge
‍
BackTestEdge
‍
Other Tools
‍
DataEdge API
RESEARCH
reports
Research Solution
‍
Reports Library
‍
actionable
Strategies
Trading Strategies
‍
Smart Stock Scanner
‍
FREE
RESOUrCES
Simple Backtest
Calculator
Simple Seasonality
Calculator
The Kelly Criterion
Calculator
Sentiment Geo Map
‍
Public Research Reports
‍
Free Webinar
COMPANY
‍
About
‍
Meet our Team
‍
In the News
‍
Testimonials
‍
Client Success Stories
Pricing
Bundle pricing
‍
Announcements
‍
FAQ
© 2024 Sundial Capital Research Inc. All rights reserved.
Setsail Marketing
TermsPrivacyAffiliate Program
Risk Disclosure: Futures and forex trading contains substantial risk and is not for every investor. An investor could potentially lose all or more than the initial investment. Risk capital is money that can be lost without jeopardizing ones’ financial security or life style. Only risk capital should be used for trading and only those with sufficient risk capital should consider trading. Past performance is not necessarily indicative of future results.

Hypothetical Performance Disclosure: Hypothetical performance results have many inherent limitations, some of which are described below. No representation is being made that any account will or is likely to achieve profits or losses similar to those shown; in fact, there are frequently sharp differences between hypothetical performance results and the actual results subsequently achieved by any particular trading program. One of the limitations of hypothetical performance results is that they are generally prepared with the benefit of hindsight. In addition, hypothetical trading does not involve financial risk, and no hypothetical trading record can completely account for the impact of financial risk of actual trading. for example, the ability to withstand losses or to adhere to a particular trading program in spite of trading losses are material points which can also adversely affect actual trading results. There are numerous other factors related to the markets in general or to the implementation of any specific trading program which cannot be fully accounted for in the preparation of hypothetical performance results and all which can adversely affect trading results.

Testimonial Disclosure: Testimonials appearing on this website may not be representative of other clients or customers and is not a guarantee of future performance or success.