
The pricking of the Big Tech bubble

Key points:
- The Nasdaq 100 has cycled from a year-over-year surge of more than 50% to now below 0%
- The handful of other cycles marked important lows for the index, with one exception
- That exception was the pricking of the internet bubble
A round trip for a vital index
The air has been let out of the Big Tech balloon. For the first time in over a year, investors are staring at a year-over-year loss in the Nasdaq 100.
This comes on the heels of what had been a historic rise. Naturally, investors are asking themselves whether this is a repeat of the pricking of the internet bubble. There are definite comparisons but also many differences, and it's probably not worth getting too worked up over a single semi-valid comparison.
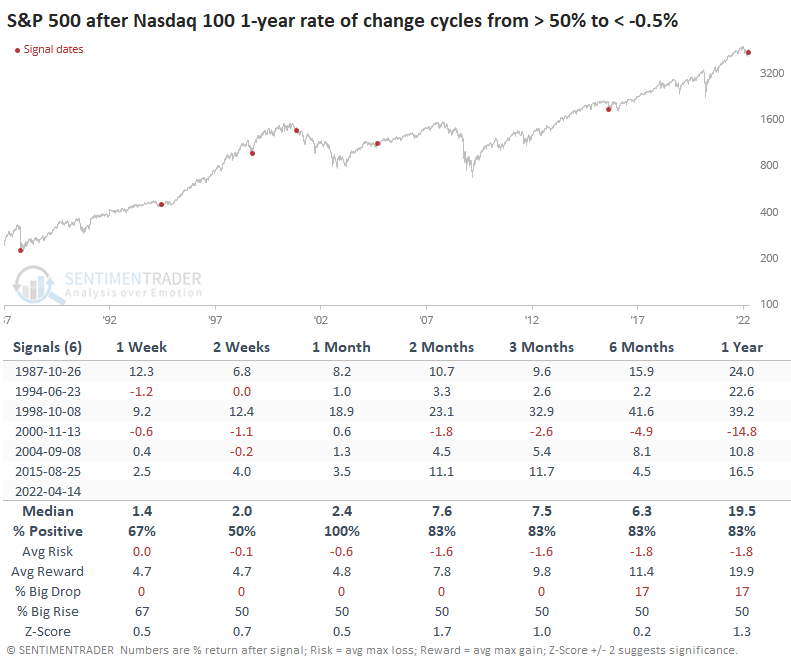
This is the 7th time the Nasdaq 100 (NDX) has cycled from a year-over-year rate of change of over +50% to below zero. Technically, this triggered on March 14th when the change barely eked below zero, but we're looking for a larger dip below the zero line for this test.
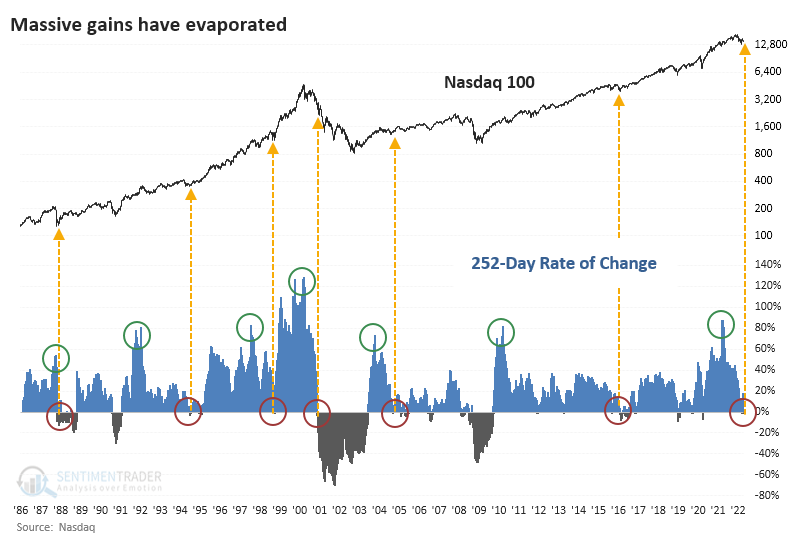
Tech stocks can be a streaky group, and they tend to respond to momentum. The lower the Nasdaq 100's rate of change, the worse its annualized forward returns tend to be.
| Rate of change | Annualized Forward Return |
| Below -10% | -7.7% |
| Below -5% | 2.4% |
| Below 0% | 16.9% |
Buyers see their opportunity
Buyers stepped in immediately five times of the six other times the NDX cycled from super gains to losses. The only failure was the pricking of the internet bubble.
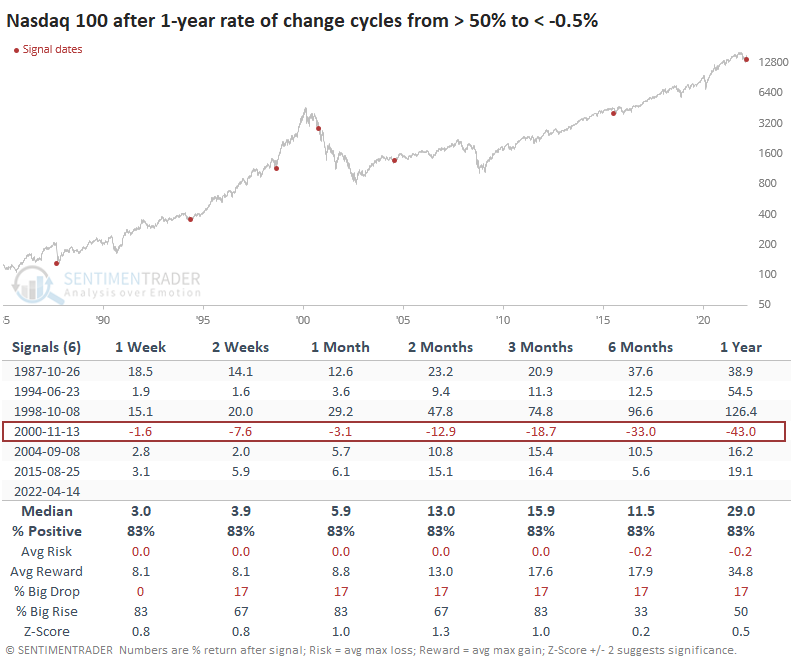
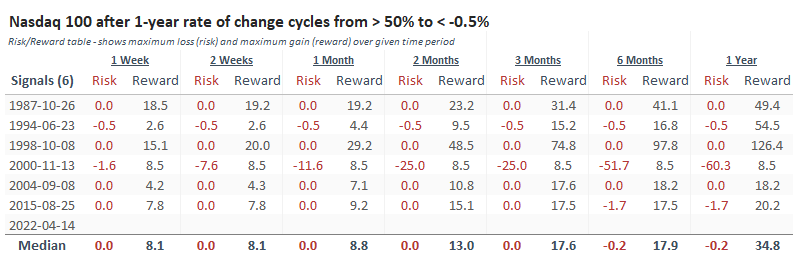
The Risk/Reward Table is one of the most consistent we've ever seen. The sample size is tiny, of course, but the consistency of the results is remarkable. The only signal when the NDX lost more than -0.5% at any point within the next three months was November 2000. As much as we can rely on a sample size of six, it's flashing a big neon sign to pay attention to the days ahead and see if buyers step in.
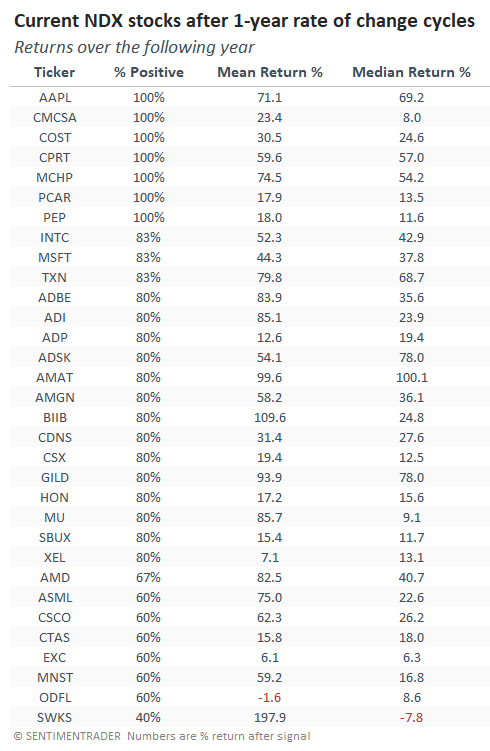
The table below shows current members of the Nasdaq 100 and their returns during the signals from the tables above. The best responder was Apple, which gained after all six signals and enjoyed a median return of +69.2% over the following year.
For the broader market, this also tended to be a good sign. The S&P 500 rallied over the next month each time, though it still suffered losses during the 2000-02 bear market.
At least somebody's buying
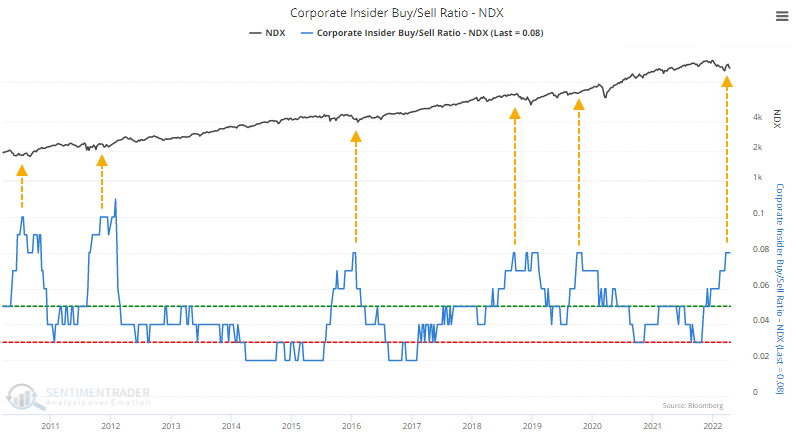
One of the curious things about this decline is that corporate insiders in these stocks are stepping up. Open market buy transactions among insiders over the last six months just hit a decade high, while insider selling fell to a three-year low. That pushed the Buy/Sell Ratio to one of the highest levels since the financial crisis.
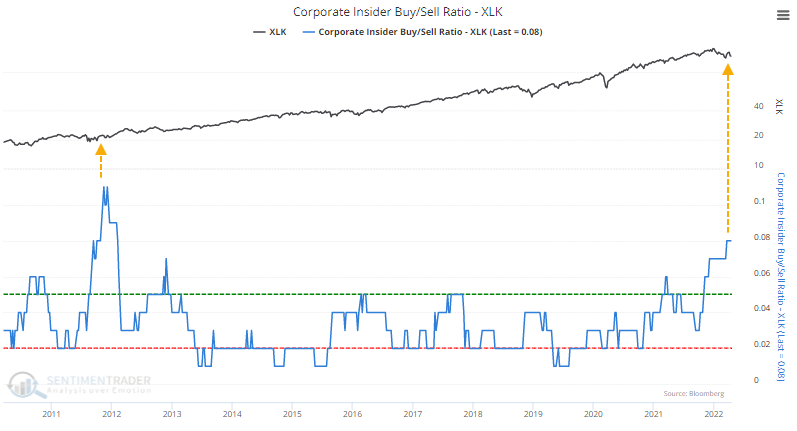
It's even more egregious in the broader technology sector where the current Buy/Sell Ratio has only been eclipsed by late 2011.
What the research tells us...
Not much, at least not yet. There is little question that we're mired in an unhealthy market environment, there is a worrying split between winners and losers, and risk appetite is in risk-off mode. That is not a good combination for stocks. The lack of follow-through from recent breadth thrusts is disturbing, and critical sectors are struggling. If buyers refuse to step in and resume the momentum in one of the key drivers of the last bull market, it will be another glaring sign that we're playing a whole new ballgame from what we've become accustomed to over the past decade. The implications from the study above are clearly positive...unless we continue to a lack of follow-through from buyers, in which case the precedent is ugly.