Data &
Technology
Research
Reports
Report Solutions
Reports Library
Actionable
Strategies
Free
Resources
Simple Backtest Calculator
Simple Seasonality Calculator
The Kelly Criterion Calculator
Sentiment Geo Map
Public Research Reports
Free Webinar
Pricing
Company
About
Meet Our Team
In the News
Testimonials
Client Success Stories
Contact
Log inLoginSign up
< BACK TO ALL REPORTS

The post-Thanksgiving year-end portfolio

Jay Kaeppel
2021-11-30
The stock market has shown a historical tendency to perform well late in the year. Three particular sectors, when traded in combination, have outperformed the S&P 500 Index handily over time.

Key Points

  • The stock market has shown a strong tendency to advance between the end of Thanksgiving week year-end
  • Real estate, financials, and health care have outperformed the S&P 500 Index during this period
  • Short-term traders may be able to take advantage using ETFs

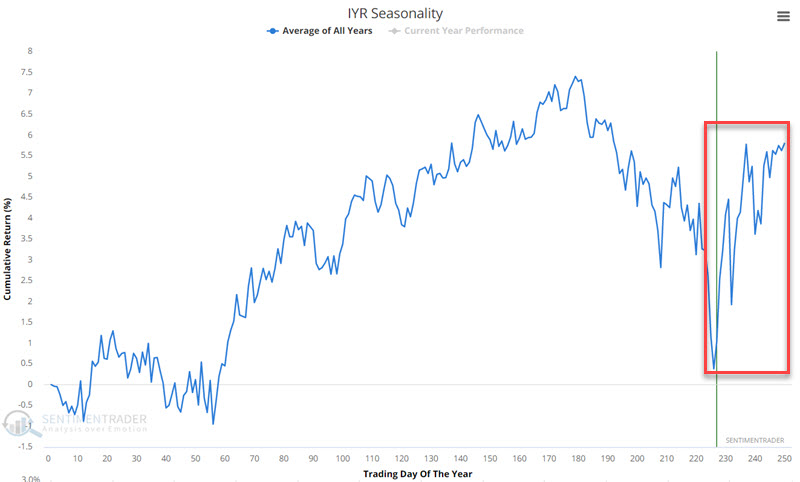
Acknowledging sector seasonality 

Certain sectors tend to perform well late in the calendar year.  The charts below display the annual seasonal trends for IYR (Real Estate), XLF (Financials), and XLV (Health Care).

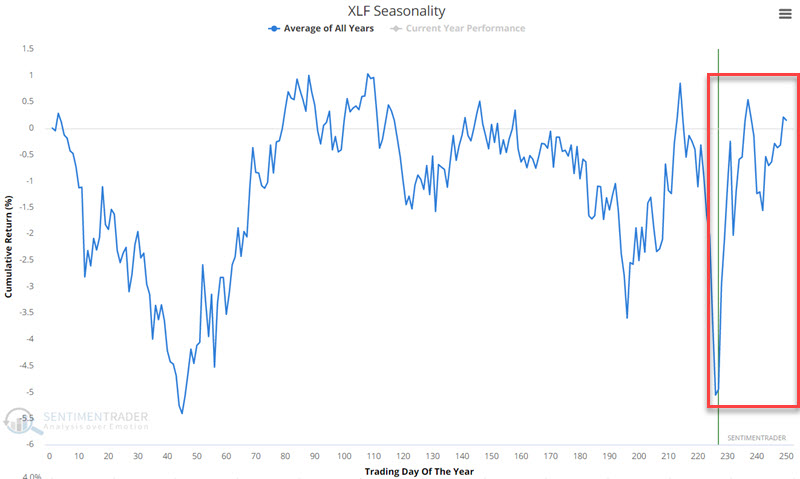
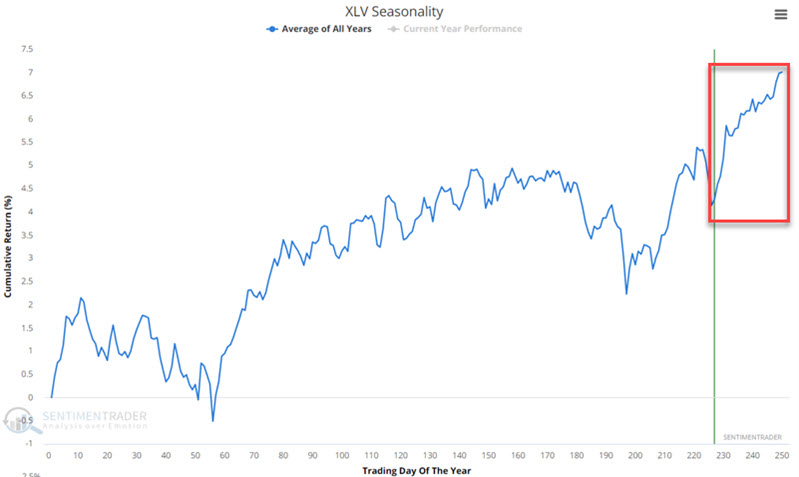
All three tend to show strength late in the calendar year. As always, these are tendencies over time, and not certainties.

Post-Thanksgiving week through year-end

For our test, we will focus on the period beginning at the close on Friday the day after Thanksgiving through the end of the calendar year. We will compare the performance of the Real Estate, Financial, and Health Care sectors to that of the S&P 500 index from 1942 through 2020.

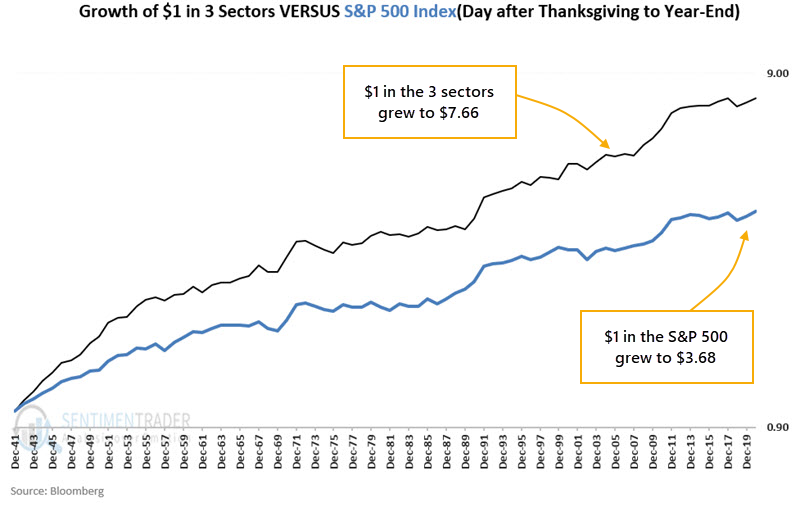
The chart below shows the hypothetical growth of $1 invested in those 3 sectors during this stretch of time.

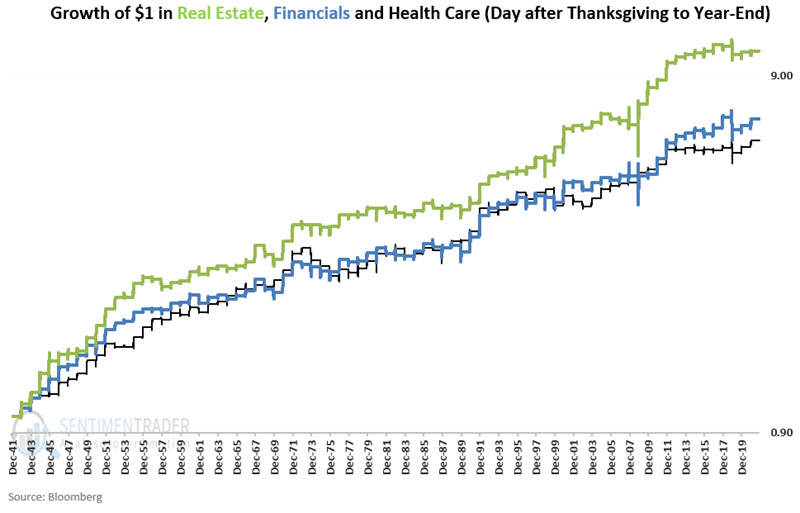
The chart below displays the growth of $1 split evenly each year among the three sectors, versus the growth of $1 invested in the S&P 500 Index each year only during the Post-Thanksgiving through Year-end period. In the 3 sectors, $1 grew to $7.66 versus only $3.68 in the S&P.

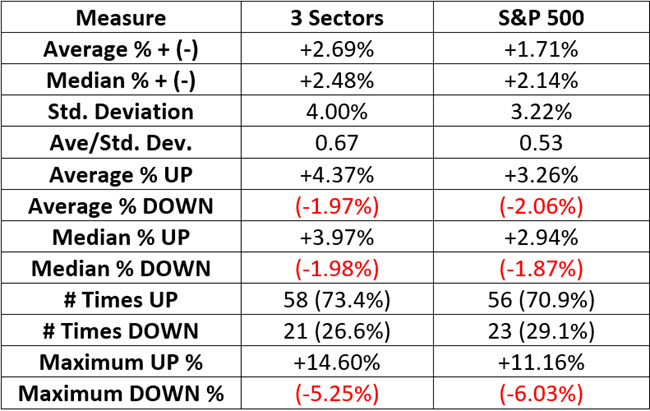
A history of consistent and wide outperformance

The table below displays the comparative figures. Over time the three-sector portfolio has outperformed the S&P 500 Index in all categories.

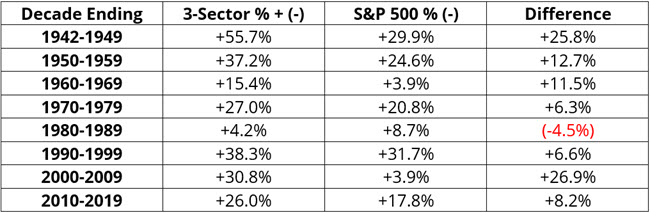
The three-sector portfolio has outperformed the S&P 500 Index in all but one calendar decade since 1942.

The chart below displays rolling 10-year returns for the three-sector portfolio minus 10-year rolling returns for the S&P 500 Index. A reading above 0 means the three-sector portfolio outperformed the S&P 500 Index over the prior 10 years.

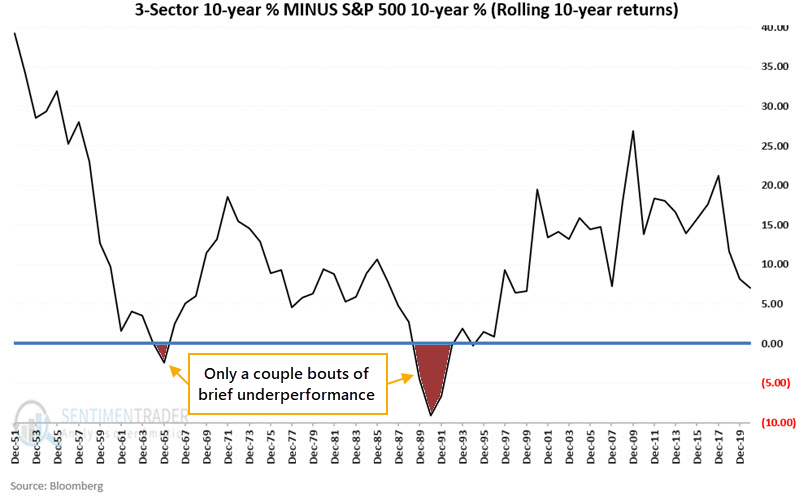
The three-sector portfolio has shown a gain during 70 out of 70 rolling 10-year periods (100%), while the S&P 500 Index has shown a gain during 67 out of 70 rolling 10-year periods (95.7%). The three-sector portfolio has outperformed the S&P 500 Index 64 out of 70 rolling 10-year periods (91.4%).

Traders can attempt to emulate this strategy using these popular ETFs:

  • IYR (iShares U.S. Real Estate ETF)
  • XLF (Financial Select Sector SPDR Fund)
  • XLV (Health Care Select Sector SPDR Fund)

What the research tells us…

The Real Estate, Financial, and Health Care sectors have tended to outperform the S&P 500 Index during the post-Thanksgiving part of the year. There is no way to predict if the three-sector portfolio will show a post-Thanksgiving gain, let alone outperform the S&P 500, but as a group that have shown a consistent tendency to do so.

Sorry, you don't have access to this report

Upgrade your subscription plan to get access
Go to Dasboard
DATA &
TECHnologies
IndicatorEdge
‍
BackTestEdge
‍
Other Tools
‍
DataEdge API
RESEARCH
reports
Research Solution
‍
Reports Library
‍
actionable
Strategies
Trading Strategies
‍
Smart Stock Scanner
‍
FREE
RESOUrCES
Simple Backtest
Calculator
Simple Seasonality
Calculator
The Kelly Criterion
Calculator
Sentiment Geo Map
‍
Public Research Reports
‍
Free Webinar
COMPANY
‍
About
‍
Meet our Team
‍
In the News
‍
Testimonials
‍
Client Success Stories
Pricing
Bundle pricing
‍
Announcements
‍
FAQ
© 2024 Sundial Capital Research Inc. All rights reserved.
Setsail Marketing
TermsPrivacyAffiliate Program
Risk Disclosure: Futures and forex trading contains substantial risk and is not for every investor. An investor could potentially lose all or more than the initial investment. Risk capital is money that can be lost without jeopardizing ones’ financial security or life style. Only risk capital should be used for trading and only those with sufficient risk capital should consider trading. Past performance is not necessarily indicative of future results.

Hypothetical Performance Disclosure: Hypothetical performance results have many inherent limitations, some of which are described below. No representation is being made that any account will or is likely to achieve profits or losses similar to those shown; in fact, there are frequently sharp differences between hypothetical performance results and the actual results subsequently achieved by any particular trading program. One of the limitations of hypothetical performance results is that they are generally prepared with the benefit of hindsight. In addition, hypothetical trading does not involve financial risk, and no hypothetical trading record can completely account for the impact of financial risk of actual trading. for example, the ability to withstand losses or to adhere to a particular trading program in spite of trading losses are material points which can also adversely affect actual trading results. There are numerous other factors related to the markets in general or to the implementation of any specific trading program which cannot be fully accounted for in the preparation of hypothetical performance results and all which can adversely affect trading results.

Testimonial Disclosure: Testimonials appearing on this website may not be representative of other clients or customers and is not a guarantee of future performance or success.