
The Post-Election Year Dead Zone - Part II

In this article, I demonstrated that the 3-month period of August, September, and October of post-election years constitutes a "dead zone" for the stock market. Let's take a closer look at market performance during this period compared to typical market performance.
NOTE: For the sake of brevity, from here out, we will refer to this 3-month period as "PEDZ" (Post-Election Dead Zone).
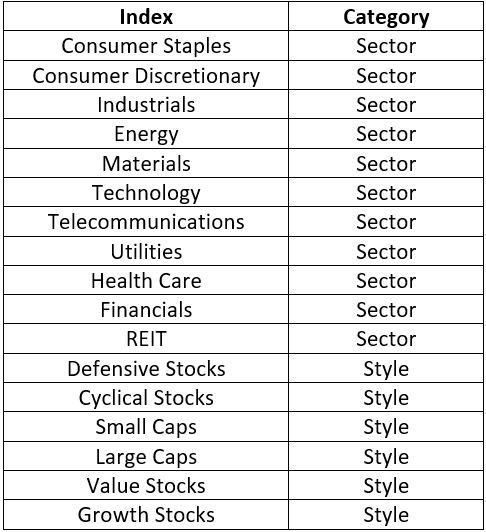
SECTORS AND STYLES
For "Sectors" and "Styles," we will use the 11 S&P 500 Industry Sectors and the 6 S&P 500 Styles since 1990. Before that, we use the Fama French Data set, which includes a wider universe of stocks.
ALL SECTORS COMBINED AND STYLES COMBINED
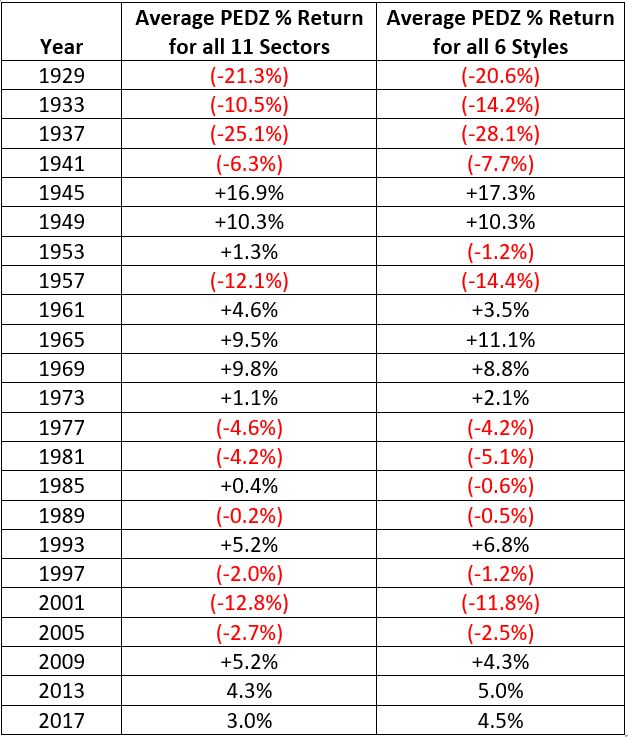
The table below displays:
- The average 3-month return for all 11 sectors (in the "Sectors" column)
- The average 3-month return for all 6 styles (in the "Styles" column)
- ONLY during August through October of each post-election year starting in 1929
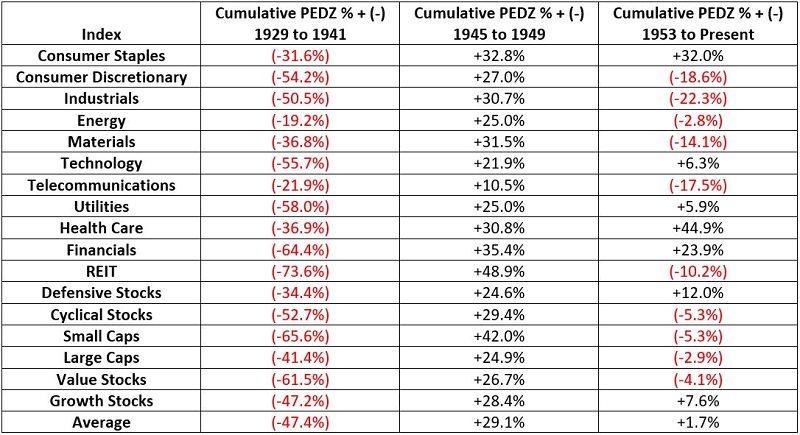
SECTORS AND STYLES INDIVIDUALLY
Now let's look at the performance of each sector and style individually. The table below displays the cumulative total return achieved for each sector or style held ONLY during August through October during post-election years starting in 1929. Performance is broken down into the 3 time periods highlighted above (i.e., 1929 through 1941, 1945 through 1949, and 1953 to present).
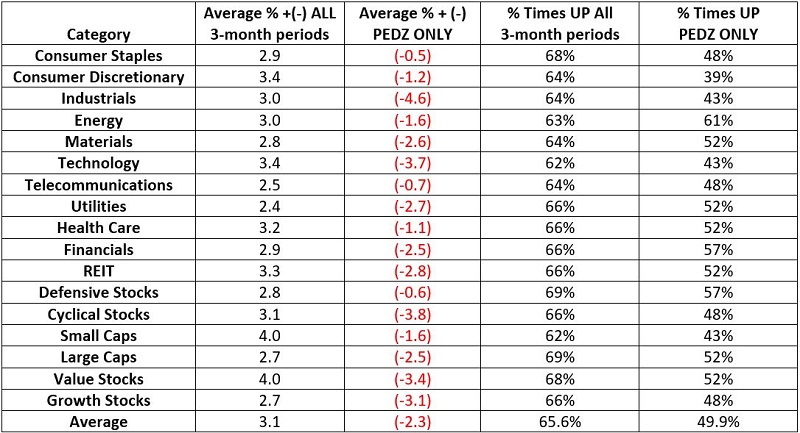
THE PEDZ VERSUS ALL 3-MONTH ROLLING PERIODS
To get a sense of just how inferior PEDZ performance has been, next we will:
- Compare performance during this particular 3-month period
- To the average performance across ALL 3-month rolling periods
The table below displays:
- The average 3-month % gain or loss across all rolling 3-month periods starting in 1929
- The average 3-month % gain or loss across all "Post-Election August through October" periods since 1929
- The % times a 3-month gain was shown across all rolling 3-month periods starting in 1929
- The % times a 3-month gain was shown across all "Post-Election August through October" periods since 1929
SUMMARY
The results in the tables above demonstrate that over time stocks have performed well below average during our 3-month Post-Election Dead Zone. But the question on investor's minds is more along the lines of "What about 2021?" Will any of this matter a wit in 2021? The reality is that there is no way to predict. There have been post-election years where stocks have performed just fine during the "dead zone."
But given that the stock market has had little more than a minor pullback so far in 2021, investors should recognize that if trouble is going to come to the market this year, history suggests that the impending three months is as likely a time as any.