Products
SentimenTrader Trading Tools
‍
Backtest Engine
My Trading Toolkit
Correlation Analysis
Seasonality
Market Prediction
Indicators & Data API
‍
Proprietary Indicators & Charts
Market Data API
Strategies & Scanner
‍
50+ Trading Strategies
Smart Stock Scanner
Smart Option Scanner
Research Reports
‍
Research Solutions
Reports Library
Free Resources
Simple Backtest Calculator
Simple Seasonality Calculator
The Kelly Criterion Calculator
Sentiment Geo Map
Public Research Reports
Education
Sentiment Indicators
Technical Indicators
Pricing
Company
About
In the News
Testimonials
Client Success Stories
Contact
Log inLoginSign up
< BACK TO ALL REPORTS

The persistent drop in volatility is bullish for stocks

Dean Christians
2023-11-08
The Volatility Index (VIX) declined for seven straight sessions. After similar downtrends in volatility, the S&P 500 was higher 93% of the time over the subsequent two months.

Key points:

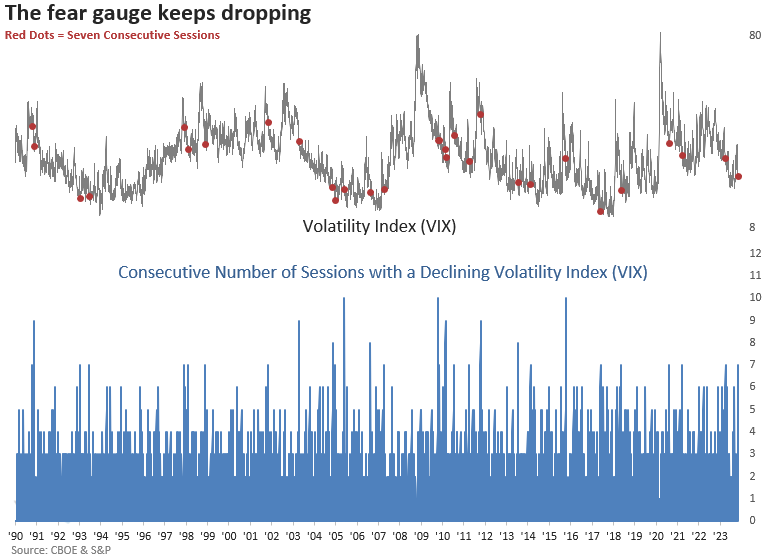
  • The Volatility Index (VIX) declined for seven successive sessions 
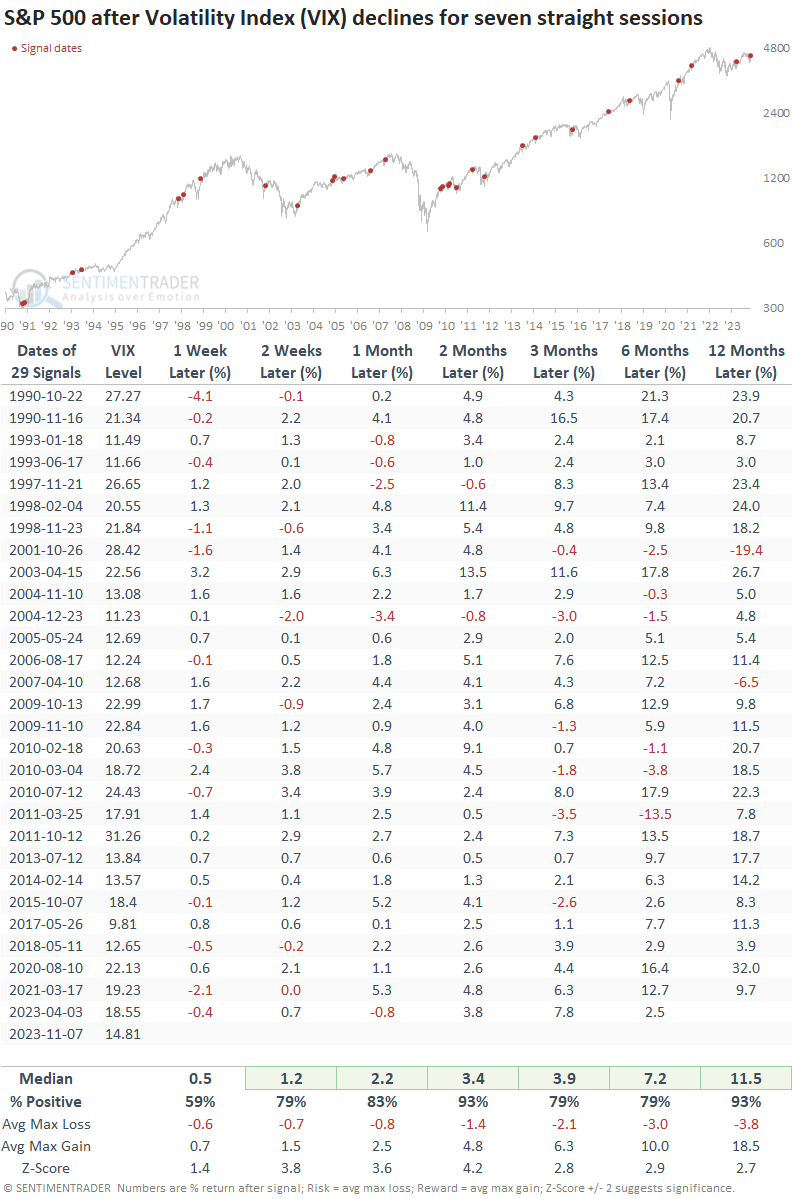
  • After similar drops, the S&P 500 was higher 93% of the time over the subsequent two months
  • The downtrend in volatility could persist, especially considering seasonality trends 

Volatility continues to mean-revert lower, which is typically bullish for stocks

The momentum in stock indexes remains relentless, as the S&P 500 has recorded gains for seven consecutive trading sessions. This consistent upswing in the world's most prominent benchmark index has led to a significant drop in the Volatility Index (VIX). 

For only the 30th time since 1990, the Volatility Index (VIX) declined for seven straight sessions. The previous instance occurred in April 2023, leading to an almost 8% gain for the S&P 500 over the subsequent three months.

Lower expected volatility is bullish for stocks

When the Volatility Index (VIX) drops for seven straight sessions, the S&P 500 displays outstanding returns, win rates, and z-scores across all time frames. 

Over the following two months, the large-cap index was higher at some point in every case, albeit one precedent was a marginal gain. 

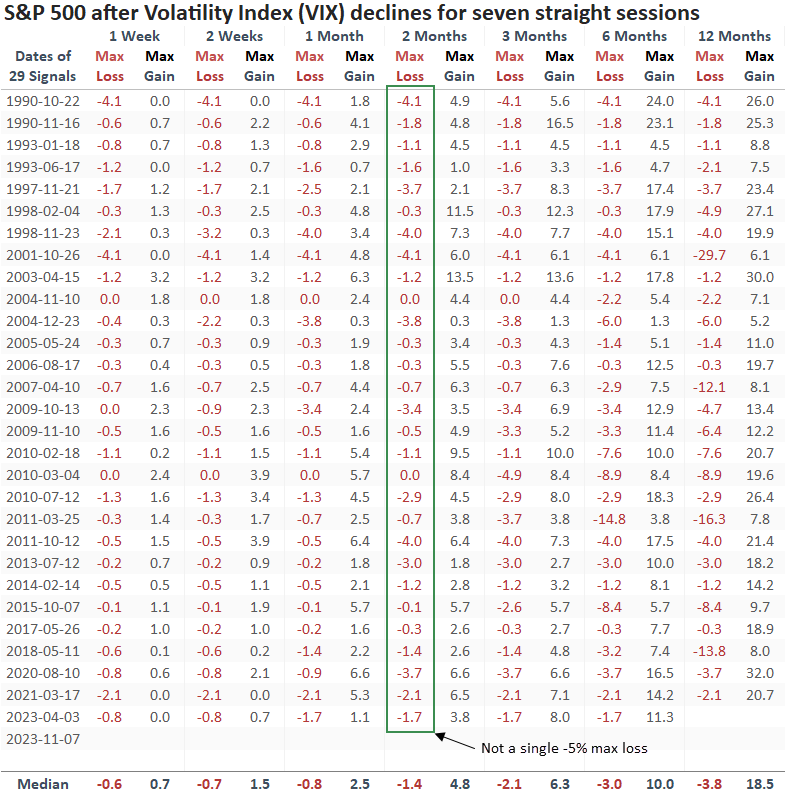
Even more astonishing than the optimistic outlook for the S&P 500 is its track record of consistently steering clear of a maximum loss of more than -5% after experiencing similar drops in expected volatility. 

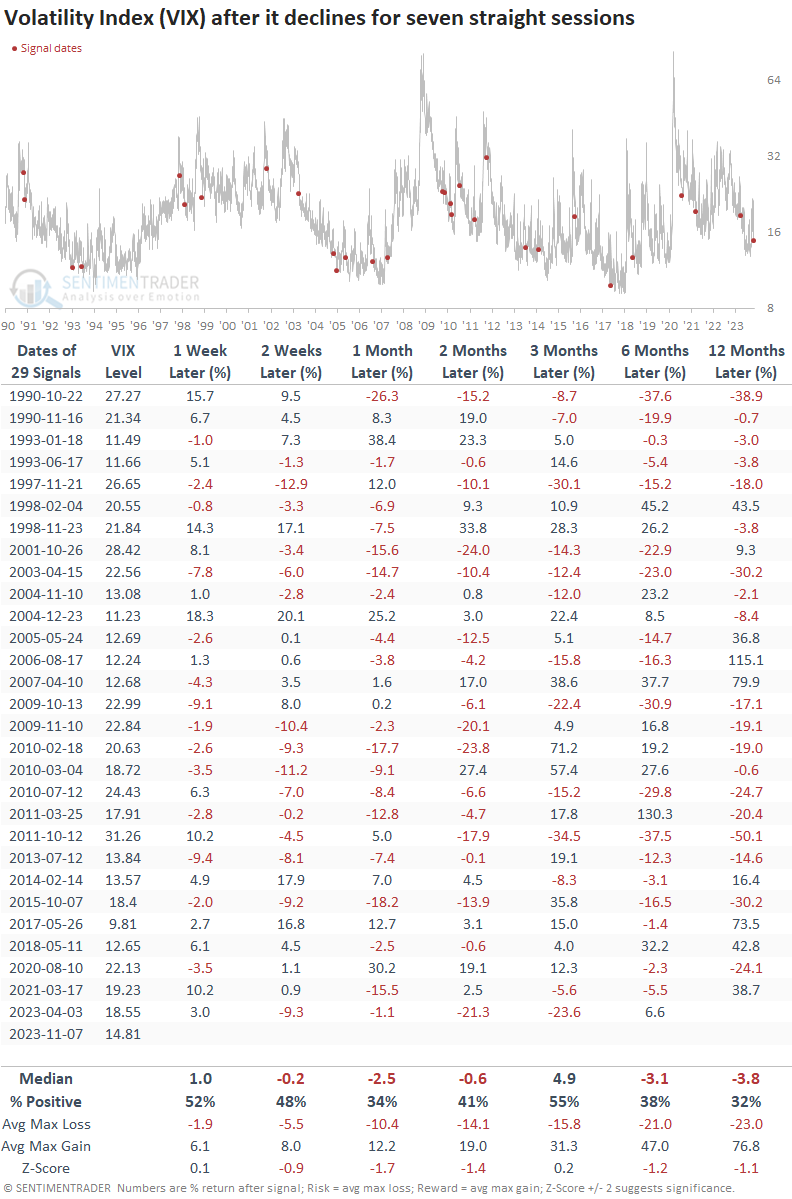
The Volatility Index has the potential to decline even more 

After seven consecutive sessions of the Volatility Index dropping, expected volatility tended to recede, with 5 out of 7 horizons showing losses and unfavorable win rates. 
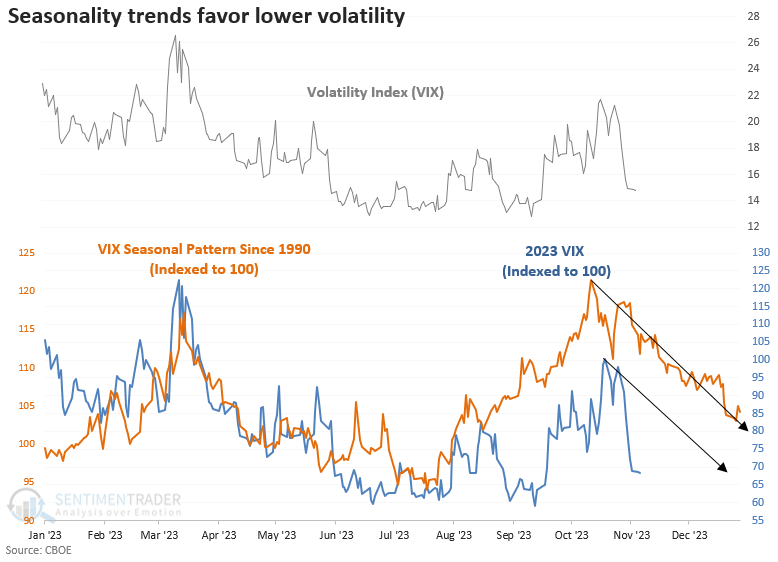
Seasonality

Seasonality for the Volatility Index (VIX) suggests the path of least resistance is lower through year-end if history rhymes.

What the research tells us...

Over the past seven trading sessions, the VIX, a measure of 30-day expected volatility, has witnessed a continuous decline, reflecting a diminished sense of apprehension among investors about the future outlook for stocks. After similar downtrends in volatility, the S&P 500 demonstrated a robust upward bias across all time frames. At the same time, the VIX was likely to continue falling.

PRODUCTS
SentimenTrader
Trading Tools
Indicators & Data API
‍
Strategies & Scanner
‍
Research Reports
FREE
RESOUrCES
Simple Backtest
Calculator
Simple Seasonality
Calculator
The Kelly Criterion
Calculator
Sentiment Geo Map
‍
Public Research Reports
‍
Education
Sentiment Indicators
‍
Technical Indicators
‍
Pricing
Bundle pricing
‍
FAQ
‍
Announcements
‍
COMPANY
‍
About
‍
In the News
‍
Testimonials
‍
Client Success Stories
CONTACT
‍
General Inquiries
‍
Media Inquiries
‍
Financial Professionals Inquiries
‍
© 2026 Sundial Capital Research Inc. All rights reserved.
Setsail Marketing
TermsPrivacyAffiliate Program
Risk Disclosure: The information and tools provided are for research and analytical purposes only and are not intended as investment advice. Market analysis involves uncertainty, and outcomes may differ from expectations. Users should conduct their own due diligence and consider their individual circumstances before making any financial decisions. Past performance is not necessarily indicative of future results.

Hypothetical Performance Disclosure: Hypothetical performance results have many inherent limitations, some of which are described below. No representation is being made that any account will or is likely to achieve profits or losses similar to those shown; in fact, there are frequently sharp differences between hypothetical performance results and the actual results subsequently achieved by any particular trading program. One of the limitations of hypothetical performance results is that they are generally prepared with the benefit of hindsight. In addition, hypothetical trading does not involve financial risk, and no hypothetical trading record can completely account for the impact of financial risk of actual trading. for example, the ability to withstand losses or to adhere to a particular trading program in spite of trading losses are material points which can also adversely affect actual trading results. There are numerous other factors related to the markets in general or to the implementation of any specific trading program which cannot be fully accounted for in the preparation of hypothetical performance results and all which can adversely affect trading results.

Testimonial Disclosure: Testimonials appearing on this website may not be representative of other clients or customers and is not a guarantee of future performance or success.