Data &
Technology
Research
Reports
Report Solutions
Reports Library
Actionable
Strategies
Free
Resources
Simple Backtest Calculator
Simple Seasonality Calculator
The Kelly Criterion Calculator
Sentiment Geo Map
Public Research Reports
Free Webinar
Pricing
Company
About
Meet Our Team
In the News
Testimonials
Client Success Stories
Contact
Log inLoginSign up
< BACK TO ALL REPORTS

The Past 200 Days Are Just Like 2019 (and 2013, and...)

Jason Goepfert
2021-09-16
There have been 18 other periods in the S&P 500's history that showed a very strong positive correlation to the index's past 200 days.

It's easy to look at a chart and cherry-pick dates to say, "Hey this looks just like that!" and make a conclusion. One of the common ones lately has been comparing the last 200 days to the initial thrust off past bear market bottoms.

Fair enough, but the past 200 sessions have been remarkable for their calm. Most other kick-offs have suffered at least some volatility along the way.

If we use the objective calculations we always do for analogs, then we can look at other 200-day periods in the S&P 500's history to see which ones have the highest correlation to the recent past. It turns out there were 18 other stretches with a very high correlation, when the S&P was also trading at a multi-year high at the time.

The chart below shows the last 200 days in the index (blue) along with the 4 most recent occurrences.

S&P 500 200 day analog correlations

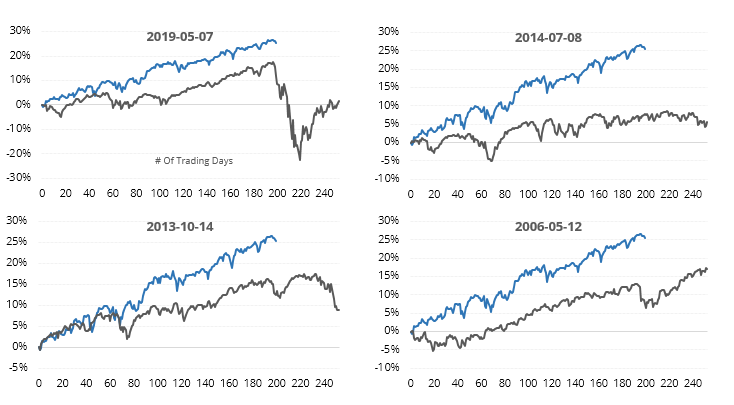
Looking at all of the precedents, shorter-term returns were not great. Across most time frames, the S&P's returns were below random, and the overall risk/reward was very poor.

One difference with our current market is just how strong the momentum and (mostly) breadth have been. The S&P just ended a historic streak with more than 75% of its members above their long-term trends, which showed that any shorter-term dips had a strong tendency to rebound in the months ahead.


What else we're looking at

  • Looking at an aggregate of the most highly-correlated 200-day periods in the S&P 500 history
  • Forward returns after those analogs ran their course
  • A monthly stock market anomaly that hides in plain sight
  • Looking at current seasonal effects in platinum and the U.S. dollar
  • A detailed look at a breath surge in Japanese shares and what it means for U.S. investors

Stat box

Traders fled the IWM Russell 2000 small-cap fund on Wednesday, as it suffered a more than $1 billion outflow. According to our Backtest Engine, other > $ 1 billion outflows in the past decade preceded a rally in IWM after 33 of 43 signals.

Etcetera

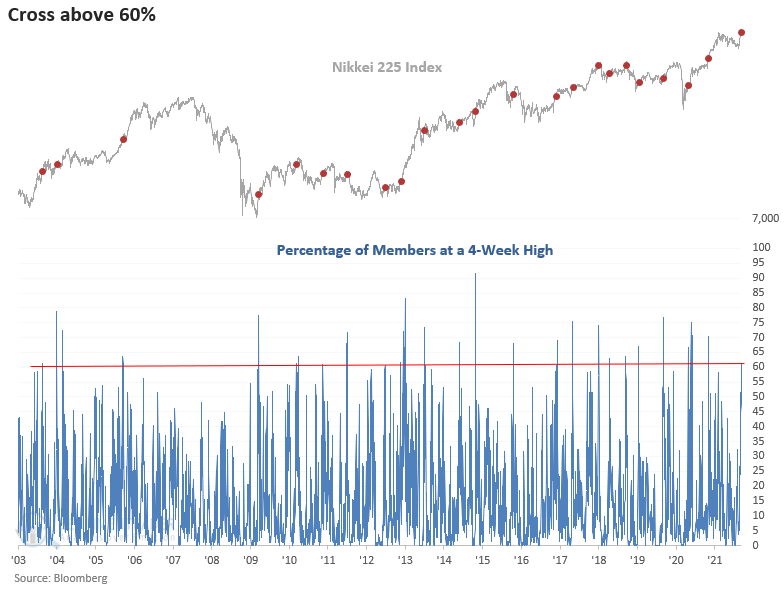
More signs of a surge. More than 60% of stocks in the Nikkei 225 index of Japanese shares jumped to a one-month high. Dean highlighted how that kind of thrust has tended to continue in the weeks ahead.

nikkei 225 japan members at 4 week high

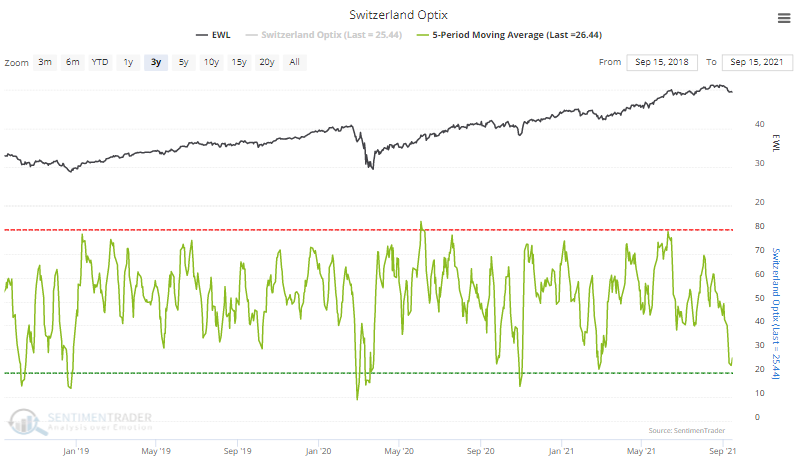
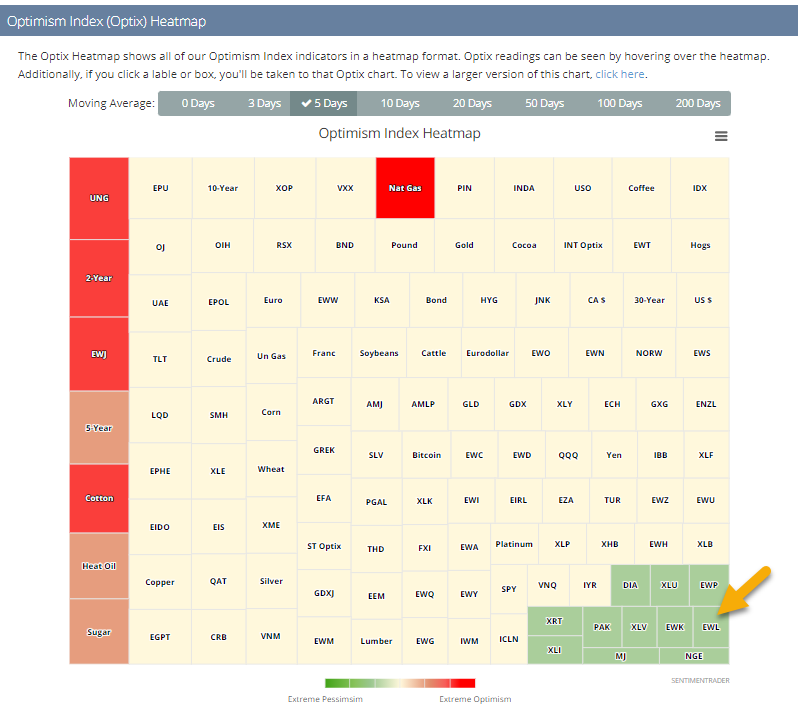
Hot (and not) markets. Our Optimism Index Heatmap shows where optimism is (and isn't) across many of the markets we cover. Over the past 5 sessions, one of the funds with the lowest optimism is EWL, focusing on Swiss stocks.

optimism index heatmap

Not neutral. Taking a closer look at optimism in Switzerland via the EWL fund, the 5-day average is trying to curl up from the 7th-lowest level in the past 3 years.

ewl switzerland optimism sentiment

DATA &
TECHnologies
IndicatorEdge
‍
BackTestEdge
‍
Other Tools
‍
DataEdge API
RESEARCH
reports
Research Solution
‍
Reports Library
‍
actionable
Strategies
Trading Strategies
‍
Smart Stock Scanner
‍
FREE
RESOUrCES
Simple Backtest
Calculator
Simple Seasonality
Calculator
The Kelly Criterion
Calculator
Sentiment Geo Map
‍
Public Research Reports
‍
Free Webinar
COMPANY
‍
About
‍
Meet our Team
‍
In the News
‍
Testimonials
‍
Client Success Stories
Pricing
Bundle pricing
‍
Announcements
‍
FAQ
© 2024 Sundial Capital Research Inc. All rights reserved.
Setsail Marketing
TermsPrivacyAffiliate Program
Risk Disclosure: Futures and forex trading contains substantial risk and is not for every investor. An investor could potentially lose all or more than the initial investment. Risk capital is money that can be lost without jeopardizing ones’ financial security or life style. Only risk capital should be used for trading and only those with sufficient risk capital should consider trading. Past performance is not necessarily indicative of future results.

Hypothetical Performance Disclosure: Hypothetical performance results have many inherent limitations, some of which are described below. No representation is being made that any account will or is likely to achieve profits or losses similar to those shown; in fact, there are frequently sharp differences between hypothetical performance results and the actual results subsequently achieved by any particular trading program. One of the limitations of hypothetical performance results is that they are generally prepared with the benefit of hindsight. In addition, hypothetical trading does not involve financial risk, and no hypothetical trading record can completely account for the impact of financial risk of actual trading. for example, the ability to withstand losses or to adhere to a particular trading program in spite of trading losses are material points which can also adversely affect actual trading results. There are numerous other factors related to the markets in general or to the implementation of any specific trading program which cannot be fully accounted for in the preparation of hypothetical performance results and all which can adversely affect trading results.

Testimonial Disclosure: Testimonials appearing on this website may not be representative of other clients or customers and is not a guarantee of future performance or success.