
The Outside Up Month: Another Arrow for the Quiver

Much of investment success comes down to assessing the "weight of the evidence" and determining whether the bullish case or the bearish case has the upper hand. Given this it is important that the tools that you use to actually weight the evidence have some history of being useful. But not every one of those tools has to be a "world-beater" – they just need to add value. In this piece let's consider a relatively obscure measure as a potential "arrow" to add to the quiver.
For data, we will use daily closing price data for the S&P 500 Index starting on 12/31/1935. Please note that we are NOT using intraday highs and lows, only closing prices.
For each month we will note the highest close and the lowest close for that month.
What we are looking for is what we will refer to as an "Outside Up Month", which involves:
- This month's highest close is above last month's highest close
- This month's lowest close is below last month's lowest close
- This month's close is greater than last month's close
What we are looking for is an "outside month" (one with a higher high and lower low than the previous month – using closing prices only) with a higher close. As it turns out, this is a fairly rare occurrence. How rare?
- Total # of months between 12/31/1933 and 12/31/2020 = 1044
- Total # of "Outside Up Months" as defined above = 50
- % of months that qualified as "Outside Up Months" = 4.8%
The real question is, does an OUM tell us anything? In other words, is there any follow through to the upside after an OUM? Let's look at the numbers to get an idea.
To answer the question, we will compare the price movement of the S&P 500 Index during the 1 to 12 months only after each OUM and see if those results are consistently better or worse that the average of ALL months since 1933.
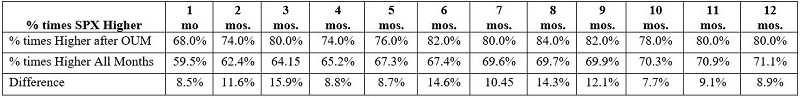
In the table below:
- The first line of data displays the percentage of times the S&P 500 Index advanced in price x-months following an "Outside Up Month"
- The second line of data shows the percentage of times the S&P 500 Index advanced looking at all 1044 months since December 1933
- The third line of data displays the difference between the two
The key thing to note in the table above is that the percentage of times the S&P 500 Index advanced after an OUM was higher for all periods (1-month to 12-months) than the average of all months for all periods measured.
Now let's look at actual price returns. In the table below:
- The first line of data displays the average S&P 500 Index percentage price gain or loss x months following an "Outside Up Month"
- The second line of data shows the average percentage gain or loss for the S&P 500 Index advanced looking at all 1044 months since December 1933
- The third line of data displays the difference between the two.
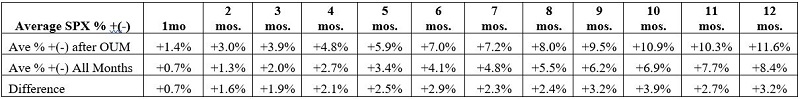
The key thing to note in the table above is that the percentage price gain for the S&P 500 Index after an OUM was higher for all periods (1-month to 12-months) than the average of all months for all periods measured.
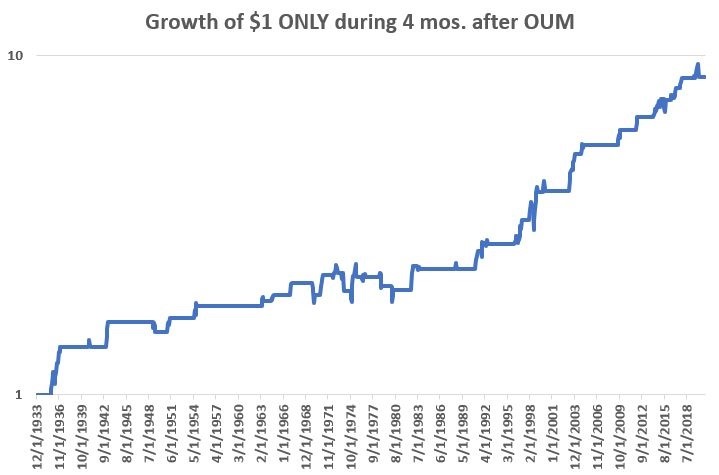
So, at this point it appears that Outside Up Months appear to have a tendency to be followed by continued market strength. To display a sense of this tendency the chart below shows the hypothetical growth of $1 invested in the S&P 500 Index ONLY during the four-month period following each OUM. Obviously not a "sure thing", but the equity curve slopes lower left to upper right, with no major declines over the 87-year period.
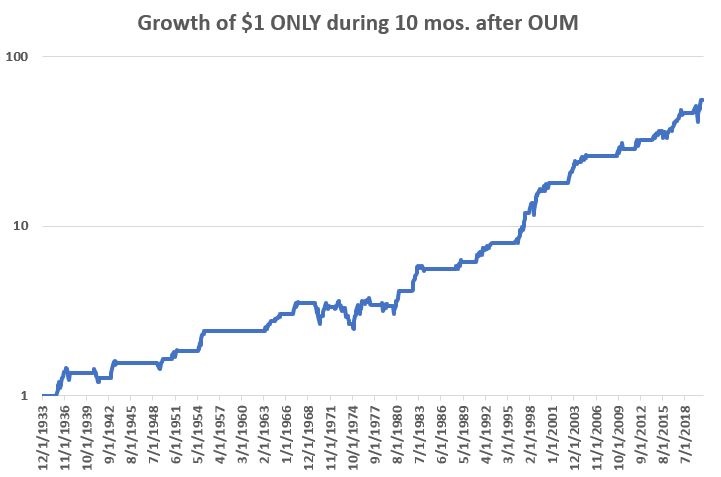
For contrast, the chart below shows the hypothetical growth of $1 invested in the S&P 500 Index ONLY during the ten-month period following each OUM. A significantly higher total gain than the previous chart, but there is a -19.3% decline in 1973 and it rode the February-March 2020 drawdown following the most recent Outside Up Month that occurred in October 2020 (although by August 2020 it was back up to a +15.2% gain).
Summary
Outside Up Months are one of those obscure things that most investors are unaware of, let alone something that gets incorporated into their analysis. It is fair to say that this particular indicator is probably best not used as a standalone indicator, as it gives signals only just under 5% of the time. Still, as a "weight of the evidence" tool it may be quite valuable. Any indicator that can be updated in about a minute a month, and whose signals have outperformed buy-and-hold both in terms of percentage of winning trades and average percentage return, may well be an arrow worth adding to the quiver.