
The Outside Up Month and the Nasdaq 100 Index

On January 14, I wrote about something I refer to as the "Outside Up Month". That article dealt with the S&P 500 Index going back to 1934. In this piece I want to look at the same principle with the Nasdaq 100 Index.
This is a longer-term look and we're still within its effective window because it only triggered a couple of months ago.
A quick note on Methodology: In the original piece I used daily closing prices only because that was all I had for some of the older SPX data. So, in that test the "high of the month" was the highest daily close during the month and the "low of the month" was the lowest daily close during the month. For the Nasdaq I have intraday high and low data available, so for this test we will use the highest intraday high and the lowest intraday low as the high and low for the month.
An Outside Up Month occurs when:
- The high for this month is greater than the high for last month
- The low for this month is less than the low for last month
- The close for this month is greater than the close for last month
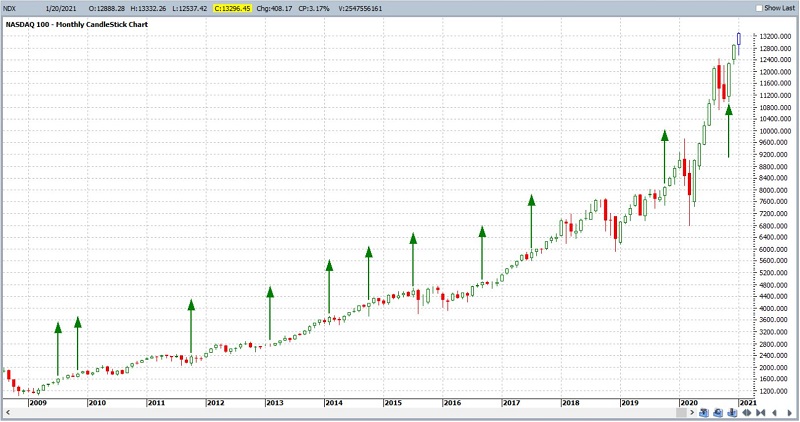
The chart below is courtesy of ProfitSource by HUBB and displays the Outside Up Months for the Nasdaq 100 Index since 2009.
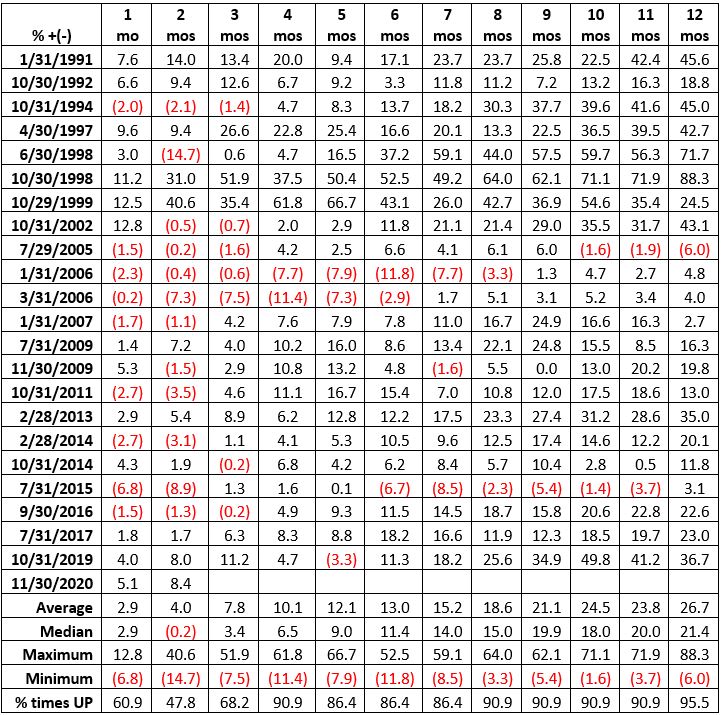
The table below shows the price return of the Nasdaq for 1-month to 12-months after each signal since 1990.
In the table below:
- The first line of data displays the percentage of times the Nasdaq 100 Index advanced in price x-months following an "Outside Up Month"
- The second line of data shows the percentage of times the Nasdaq 100 Index advanced looking at all months since November 1990
- The third line of data displays the difference between the two
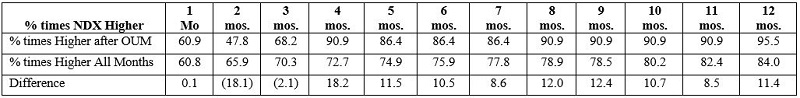
Interestingly, the NDX was higher less often 2 and 3 months after an Outside Up Month than for All Months. All time periods beyond 3 months saw the Nasdaq 100 gain ground a very high percentage of time (86% or more), and significantly more often than for All Months.
Now let's compare post-OUM returns to returns for All Months:
- The first line of data displays the average Nasdaq 100 Index percentage price gain or loss x-months following an "Outside Up Month"
- The second line of data shows the average percentage gain or loss for the Nasdaq 100 Index advanced looking at all months since November 1990
- The third line of data displays the difference between the two
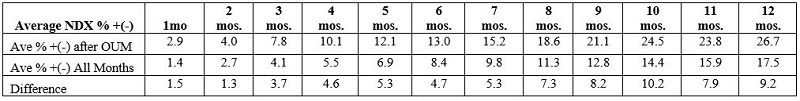
The key thing to note in the table above is that the percentage price gain for the Nasdaq 100 Index after an OUM was higher for all periods (1-month to 12-months) than the average of All Months for all periods measured.
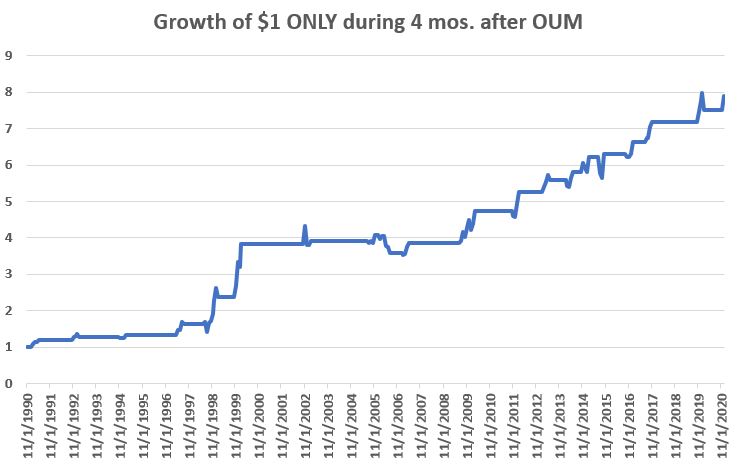
So, at this point, it appears that Outside Up Months appear to have a tendency to be followed by continued market strength. To display a sense of this tendency the chart below shows the hypothetical growth of $1 invested in the Nasdaq 100 Index ONLY during the four-month period following each OUM. Obviously not a "sure thing", but the equity curve slopes lower left to upper right, with no major declines over the 30+-year period.
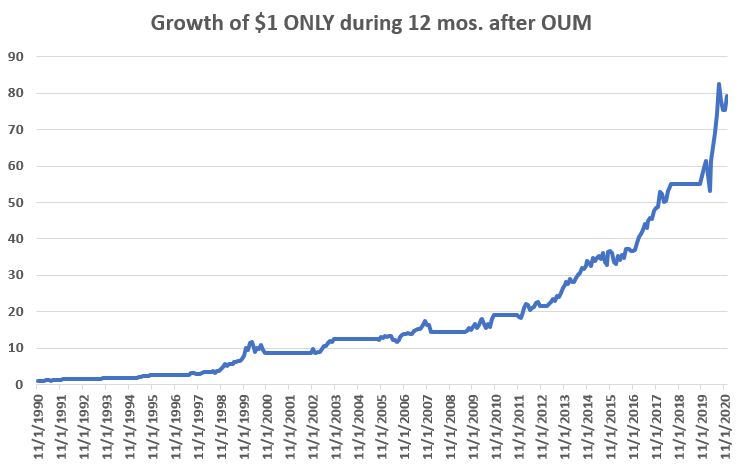
For contrast, the chart below shows the hypothetical growth of $1 invested in the Nasdaq 100 Index ONLY during the 12-month period following each OUM. A significantly higher total gain than the previous chart, but it did ride the February-March 2020 drawdown following the Outside Up Month that occurred in October 2019 (although by the end of October 2020 the 12-month price gain was +36.7%).
Summary
The Nasdaq 100 Index experienced an Outside Up Month at the end of November 2020. So does this mean the index is "a sure thing" to stage another rip-roaring advance in the months ahead? Not at all. Many other indicators are signaling a very overbought market and many sentiment measures are suggesting rampant bullishness across the investor universe (a typically contrary signal). Still, the history of Outside Up Months suggests that investors give the bullish case the benefit of the doubt until the market gives them some real reason to doubt it.