
The Out-of-the-Money Call Calendar Spread

The Out-of-the-money (OTM) calendar spread is an options trading strategy that can allow a trader to speculate on an increase in the price of a stock, index, ETF, or futures contract without tying up a lot of capital - and in many cases - with a relatively low dollar risk. It can also benefit from an increase in volatility after the trade is entered.
This strategy can be extremely handy in a "low conviction" situation. For example:
- You see a stock breaking out to a new high
- You think the up move may continue
- You are seriously not in the mood to get whipsawed (you buy the stock and it immediately reverses)
- You are not overly excited about committing a lot of capital to buy the stock
- But you feel compelled to make a play
A lot of us have been in this situation - or something similar to it. This is just one situation where a calendar spread can come in handy.
The Mechanics
The mechanics are simple:
- Buy a call option at a strike price above the current price of the underlying stock in a further out expiration month
- Sell a call option at the same strike price in a nearer expiration month
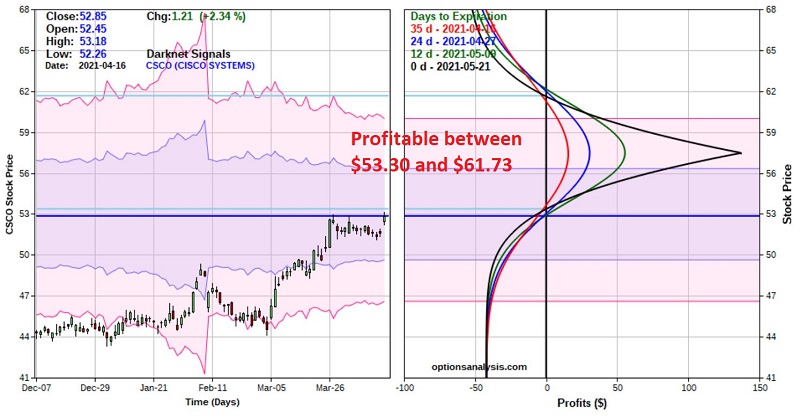
Let's use an example to illustrate this approach. In the chart below we see that CSCO is attempting to break out to a new high. Let's say that a trader "hopes" the move will follow through and wants to participate, but just is not inclined to commit $5,296 to buy 100 shares of CSCO at $52.96 a share. The trade below offers an alternative approach.
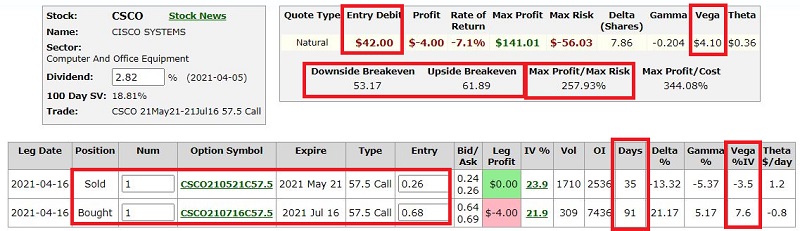
- Buy 1 Jul16 57.5 call @ $0.68
- Sell 1 May21 57.5 call @ $0.26
The screenshot below displays the particulars and the chart below that displays the risk curves for entering a 1-lot of this position through option expiration on May 21st. (All charts below are courtesy of www.OptionsAnalysis.com)
The key things to note:
- A 1-lot costs $42 to enter. This is the maximum risk on the trade
- If the trader buys a 10-lot everything - including maximum profit potential and maximum risk gets multiplied by 10
- If CSCO does in fact follow through to the upside the risk curves rise as the stock price rises until it reaches the strike price of $57.50, at which point the risk curves "roll-over"
- IF CSCO does reach $57.50 during the life of the May option, the expected open profit will be somewhere between +$19 (+45% of $46 cost) to roughly +$140 (+333% of $46 cost) but it should be noted that the maximum profit would only be realized if CSCO closed at exactly $57.50 a share on exactly May 21st which is highly unlikely
- With volatility at its current level, the breakeven prices for this trade are $53.30 on the low end and $61.73 on the high end
- If CSCO does NOT follow through and begins to decline we know that the worst thing that can happen is a loss of -$42 (per 1-lot) if we hold all the way until expiration
Trade Preparation and Position Management
The first thing to decide is what to do if things go south? There are two basic choices:
- Cut bait
- Let it ride
Here is where holding a cheap option position can be beneficial. If a trader commits a large amount of capital to buy shares of stock, good money management basically requires that he or she cut a loss at some point if the stock starts to decline. On the other hand, the options trader can also cut a loss early, however, given the low maximum dollar risk the notion of simply holding on and giving the stock a chance to bounce back can be a very viable option.
On the upside, a trader must pay close attention if CSCO trades near the strike price of $57.50. If this happens - and armed with the knowledge that the risk curve will roll over and start trending lower again if the price moves beyond $57.50 the trader can make plans to either:
- Adjust the open position - hopefully locking in a profit and/or reducing risk in the process
- Close the trade and take whatever profit is available at the time the stock approaches $57.50 a share
One other possibility to consider if the trader thinks the breakout is for real and will continue AND CSCO reaches the strike price of $57.50, he or she can:
- Exercise the long call (July 57.50) and buy 100 shares of CSCO
- Buy back the short call (May 57.50), leaving the trader long 100 shares of CSCO now that they have a high conviction
One Additional Key Factor in Calendar Spreads
Changes in implied options volatility after a position is entered can have a profound impact on a calendar spread.
In the first Figure above, you can note that the call purchased has:
- An "IV%" (implied volatility) of 21.30
- A "Vega %IV" (Vega) of 7.6 (or $7.60)
the call sold has:
- An "IV%" (implied volatility) of 23.90
- A "Vega %IV" (Vega) of 3.5 (or $3.50)
If the implied volatility for each option were to rise one full percentage point (from 21.30% to 22.30% for the call purchased and from 23.90% to 24.90% for the call sold):
- The long call would gain $7.60 in value based solely on an increase in time premium which is caused solely by the increase in volatility
- The short call would gain $3.50 in value based solely on an increase is time premium which is caused solely by the increase in volatility
- As a result, the net position has a positive Vega of $4.1
The key thing to note: longer-term options have higher Vega than shorter-term options.
The bottom line is that after we enter this trade:
- A subsequent rise in volatility can inflate the value of our position
- A subsequent decline in volatility can deflate the value of our position
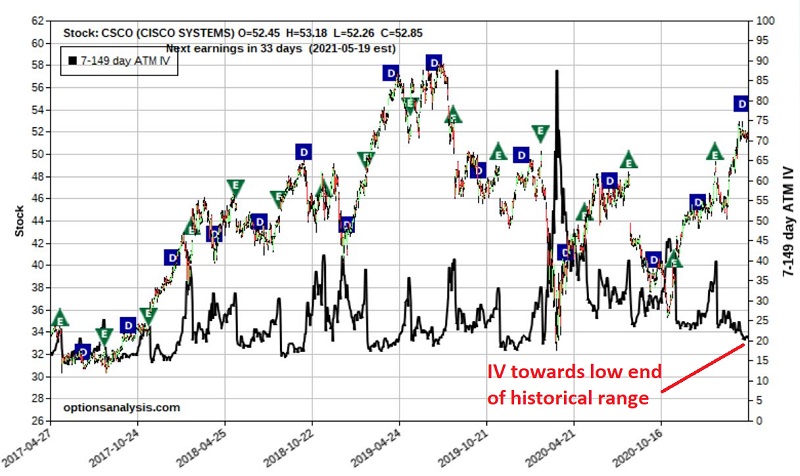
So, let's back up a step to the time BEFORE we enter the trade. Ideally, we want to put on a calendar spread when implied volatility is relatively low so that we can pay less to enter the position, we have the potential to see an increase in position value if volatility rises, and we have less potential for a "volatility crush" that can deflate the value of our position if volatility falls sharply after we enter the trade.
The chart below shows 4 years of price history for CSCO along with four years of IV history (the dark black line). As you can see at the far right-hand side of the chart, the current level of IV is presently near the low end of the historical range. This does not mean that volatility cannot decline further but it does put us in a better position to benefit from a subsequent rise.
For the record, I am completely agnostic on whether or not CSCO will actually breakout successfully to the upside. And the trade detailed above is NOT a "recommendation." It serves only as a vehicle to illustrate the mechanics - and relative pros and cons - of the out-of-the-money call calendar spread.