The Oldest Technical Trading System Just Triggered a Sell Signal

For the first time in over a year, one of the oldest forms of technical analysis has triggered a sell signal.
There is no "official" record of buys and sells according to Dow Theory, but the basic setup is fairly standard.
"The Dow theory is a financial theory that says the market is in an upward trend if one of its averages (i.e. industrials or transportation) advances above a previous important high and is accompanied or followed by a similar advance in the other average.
A reversal in the primary trend is signaled when the market is unable to create another successive peak and trough in the direction of the primary trend. For an uptrend, a reversal would be signaled by an inability to reach a new high followed by the inability to reach a higher low. In this situation, the market has gone from a period of successively higher highs and lows to successively lower highs and lows, which are the components of a downward primary trend." - Investopedia
TRIGGER CONDITIONS
When we've looked at this in the past, we've used the historical record of buy and sell signals from TheDowTheory.com, a site specializing in analyzing these signals. It's unknown whether they consider Friday's moves in the Dow Industrials and Transportation averages to be a sell signal. Still, it does meet the criteria, or if not, it's close enough to consider. Trying to split hairs based on arbitrary rules is silly - it's the concept that counts.
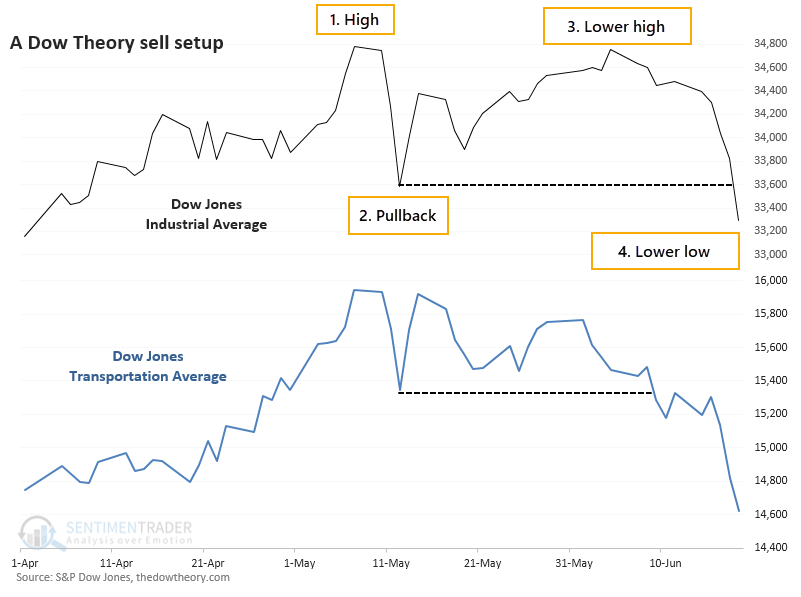
For a sell signal, both averages should:
- Set a new high
- Pull back in a reaction against those new highs
- Rebound by 3% or more but without setting a higher high
- Decline below the pullback low
That pretty much sums up the past two months in the averages.
Since the year 1900, there have been 47 prior sell signals. Not surprisingly, the Dow Industrials have not responded well.
Over the next three months, the Dow managed to rally only 34% of the time. Across all time frames, the risk/reward was skewed toward "risk" and the Dow's median return was at least 2 standard deviations below random.
If there's any solace here for investors, it's that sell signals since the end of the financial crisis have mostly been terrible. They would have prevented some uncomfortable losses in 2011, 2018, and 2020, and a few other modest ones. But all were brief and ended up leading to gains during the next 3-6 months.
What else we're looking at
- Full returns in the Dow Industrials and Transports since 1900 after Dow Theory sell signals
- What recent years have done to Dow Theory
- What sectors and factors did following these sell signals
- There has been a spike in 21-day lows vs 21-day highs - what happens next
- Why it's a good time to keep a close eye on energy stocks
- Updating absolute and relative ETF trends across industries, sectors, and countries

| Stat box The latest Commitments of Traders report shows that speculators are net long $56 billion worth of S&P 500 futures. That's a new record. |
Etcetera
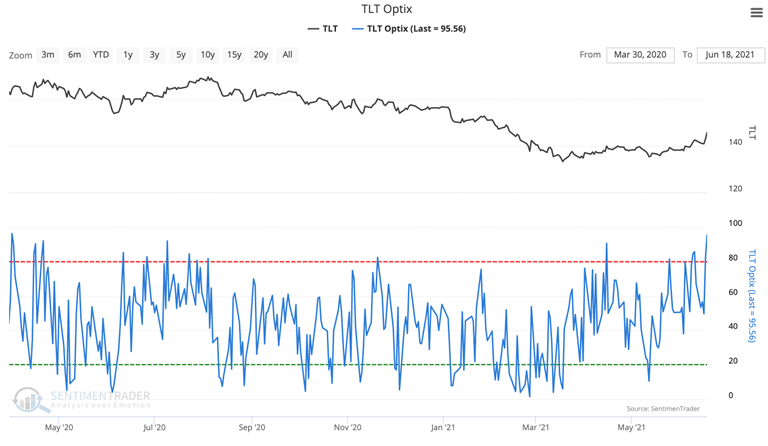
Long-term bonding. The TLT Optix has reached its highest point since April 2020, shooting to 95.5. This shows a sudden, and severe, jump in optimism toward Treasuries.
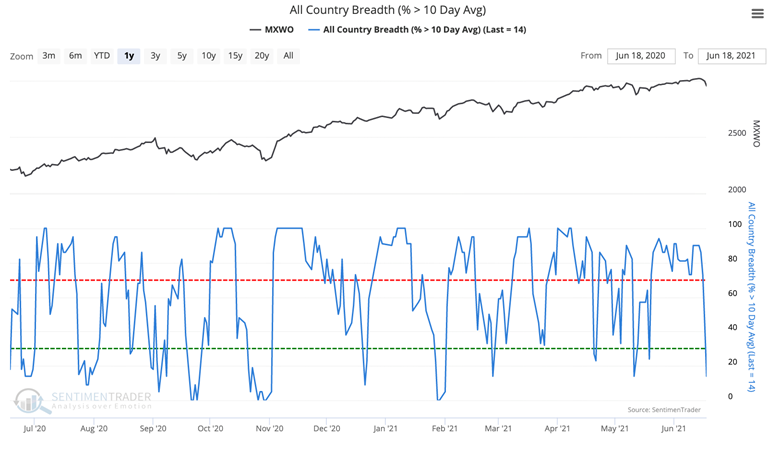
International descent. The All Country Breadth (% 10 Day Avg) has dropped sharply on Friday, indicating a sizable portion of major country equity indexes are trading below their 10 Day moving averages.
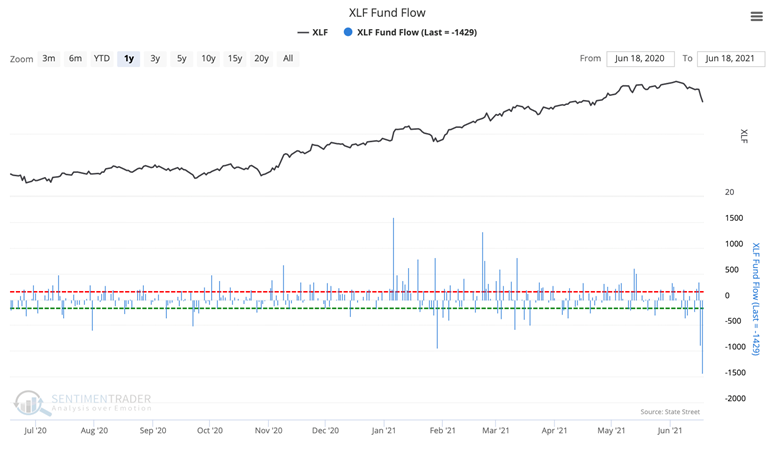
Finance flop. The XLF Fund had $1.4 billion withdrawn on Friday, the largest amount in the last year.