Data &
Technology
Research
Reports
Report Solutions
Reports Library
Actionable
Strategies
Free
Resources
Simple Backtest Calculator
Simple Seasonality Calculator
The Kelly Criterion Calculator
Sentiment Geo Map
Public Research Reports
Free Webinar
Pricing
Company
About
Meet Our Team
In the News
Testimonials
Client Success Stories
Contact
Log inLoginSign up
< BACK TO ALL REPORTS

The OECD composite leading indicators trigger a buy signal

Dean Christians
2023-07-11
Composite leading indicators, as measured by the OECD, have experienced a simultaneous upswing globally, triggering a bullish signal for stocks. Similar reversals in a diffusion index for CLIs preceded excellent returns for the S&P 500. The economic tailwind tends to favor sectors and factors with an offensive tilt.

Key points:

  • A diffusion index for the OECD composite leading indicators triggered a buy signal
  • Similar reversals in the OECD CLI preceded excellent returns for the S&P 500
  • The TCTM Composite Confirmation Model signal count increased to 40% with the new CLI alert

A resurgence in the OECD composite leading indicators

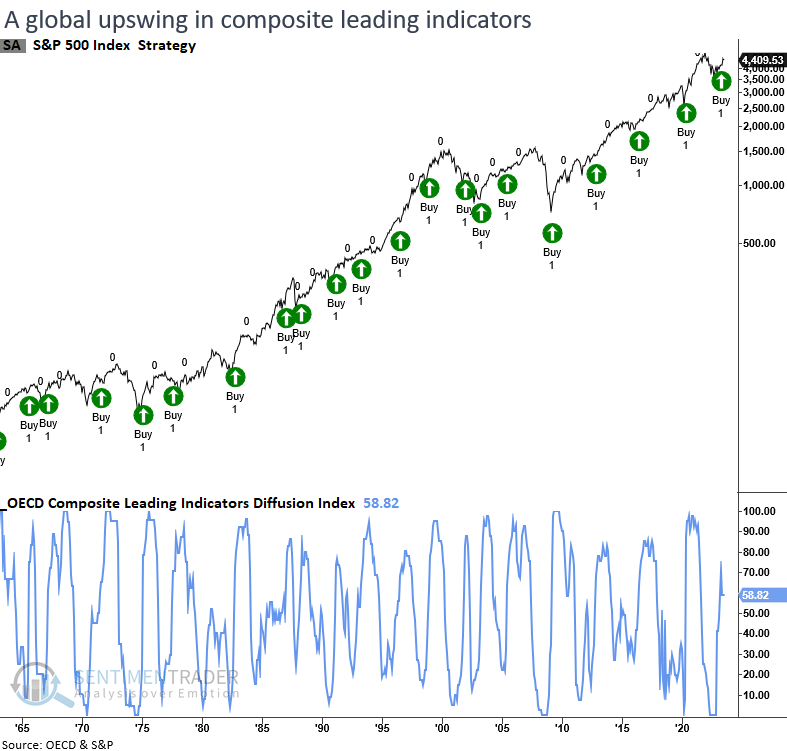
The Organization for Economic Cooperation and Development (OECD) compiles a composite of leading indicators for countries worldwide. By aggregating these individual country indicators into a diffusion index, it becomes possible to detect a revival in economic trends, which typically creates favorable conditions for the stock market. 

The OECD CLI Diffusion Index, which tracks the proportion of CLIs rising month-over-month, declined to 0% in 2022 but has now reversed higher, triggering a buy signal when it exceeded 60%.

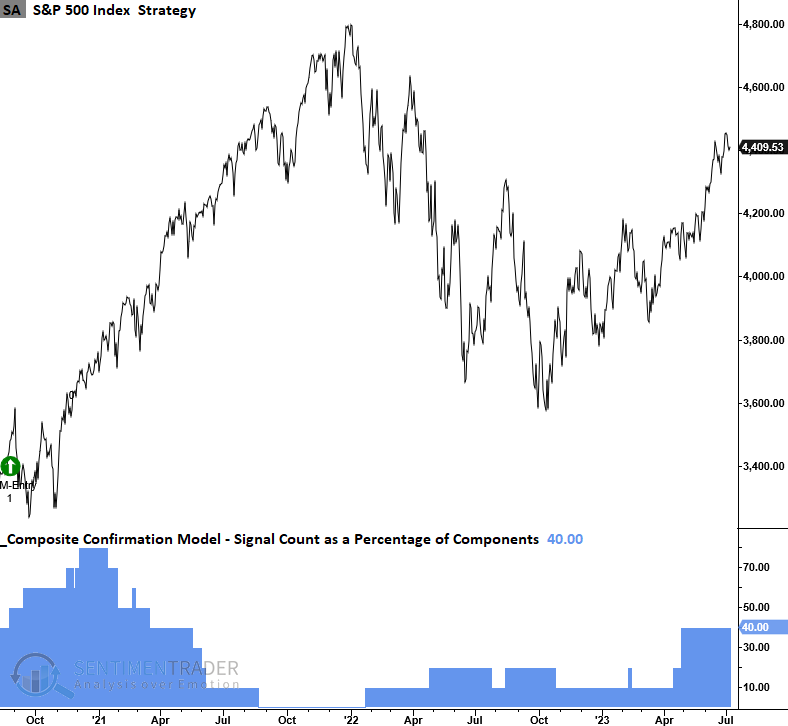
The TCTM Composite Confirmation Model signal count increased to 40% with the new composite leading indicators buy signal. 

A couple of items to note about the OECD data series: First, revisions occur each month, so I wait a few months to see whether an initial alert holds through the revisions. Second, the OECD stopped calculating data for several countries in January 2023. The series now contains G20 countries.

A resurgence in CLIs preceded excellent returns

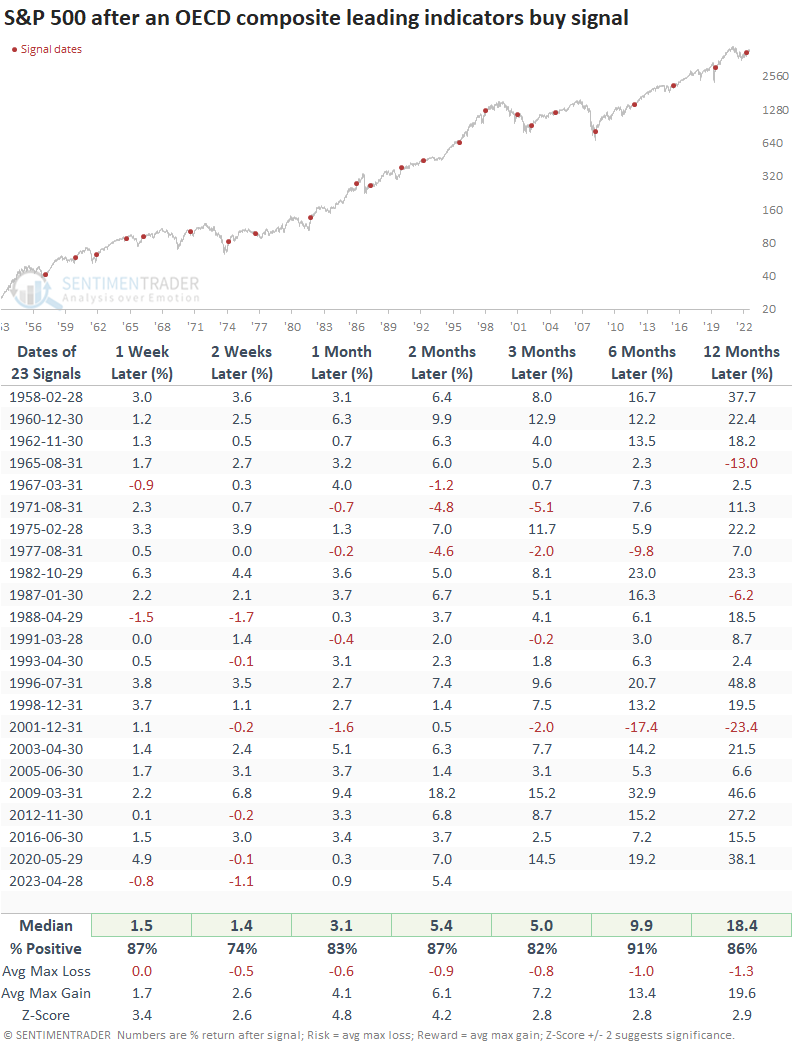
Whenever the diffusion index for the OECD CLIs climbs above 60% after falling below 40%, the S&P 500 displays remarkable returns, win rates, and z-scores across all time frames. Six months later, the S&P 500 was higher in all but two precedents. The only notable whipsaw occurred in 2001 when several other economic indicators yielded optimistic signals that ultimately proved unsuccessful.

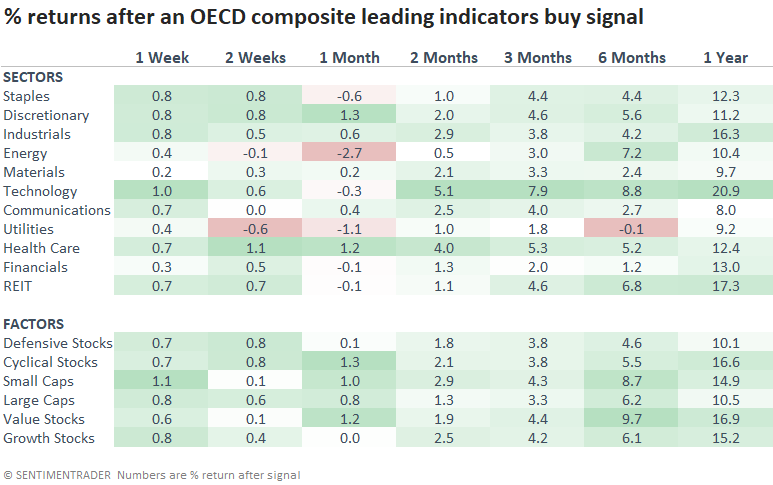
From a sector perspective, Technology is a clear-cut winner, which aligns with current relative strength trends. Favorable factors include cyclical stocks, small-caps, and value, all of which outperform their counterparts in terms of performance.

TCTM Composite Confirmation Model

Should the Composite Confirmation Model exceed the critical 50% threshold, it would provide validation for the new uptrend. As a reminder, the CCM contains big-picture price and fundamental measures, so it's not a market timing mechanism like the Composite Thrust Model.  


What the research tells us...

Despite facing a barrage of negative news over the past nine months, the S&P 500 and other indexes have defied expectations and continued to rise, indicating that the market has already factored in the pessimistic developments. Whether we consider indicators such as the Sentimentrader Macro Index Model or the OECD CLIs, the recent improvement in economic trends suggests the uptrend for stocks can continue.

Sorry, you don't have access to this report

Upgrade your subscription plan to get access
Go to Dasboard
DATA &
TECHnologies
IndicatorEdge
‍
BackTestEdge
‍
Other Tools
‍
DataEdge API
RESEARCH
reports
Research Solution
‍
Reports Library
‍
actionable
Strategies
Trading Strategies
‍
Smart Stock Scanner
‍
FREE
RESOUrCES
Simple Backtest
Calculator
Simple Seasonality
Calculator
The Kelly Criterion
Calculator
Sentiment Geo Map
‍
Public Research Reports
‍
Free Webinar
COMPANY
‍
About
‍
Meet our Team
‍
In the News
‍
Testimonials
‍
Client Success Stories
Pricing
Bundle pricing
‍
Announcements
‍
FAQ
© 2024 Sundial Capital Research Inc. All rights reserved.
Setsail Marketing
TermsPrivacyAffiliate Program
Risk Disclosure: Futures and forex trading contains substantial risk and is not for every investor. An investor could potentially lose all or more than the initial investment. Risk capital is money that can be lost without jeopardizing ones’ financial security or life style. Only risk capital should be used for trading and only those with sufficient risk capital should consider trading. Past performance is not necessarily indicative of future results.

Hypothetical Performance Disclosure: Hypothetical performance results have many inherent limitations, some of which are described below. No representation is being made that any account will or is likely to achieve profits or losses similar to those shown; in fact, there are frequently sharp differences between hypothetical performance results and the actual results subsequently achieved by any particular trading program. One of the limitations of hypothetical performance results is that they are generally prepared with the benefit of hindsight. In addition, hypothetical trading does not involve financial risk, and no hypothetical trading record can completely account for the impact of financial risk of actual trading. for example, the ability to withstand losses or to adhere to a particular trading program in spite of trading losses are material points which can also adversely affect actual trading results. There are numerous other factors related to the markets in general or to the implementation of any specific trading program which cannot be fully accounted for in the preparation of hypothetical performance results and all which can adversely affect trading results.

Testimonial Disclosure: Testimonials appearing on this website may not be representative of other clients or customers and is not a guarantee of future performance or success.