
The new interest rate hiking cycle

Key points:
- The Federal Reserve's shift to a major hiking cycle is mostly unfriendly to stock returns
- The beginnings of other cycles preceded mostly poor returns but was dependent on the sector
- Big positive reactions on the day of a rate hike had a hard time being sustained
Policy shift is mostly unfriendly
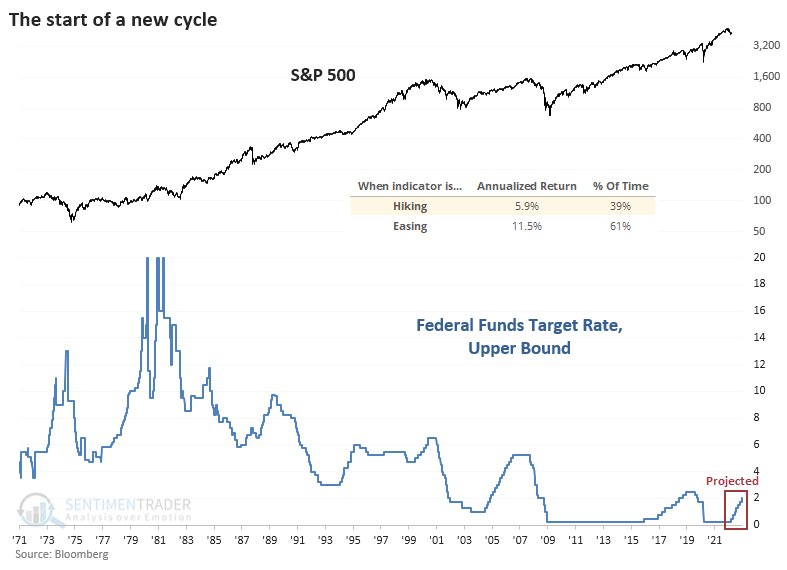
The Federal Reserve has made it official - we're now in an environment of a rising target interest rate.
The Fed has only specifically targeted a rate and communicated it to the market since the early 1980s. Still, using Bloomberg data for the upper bound of the target rate since 1971, the S&P 500 has shown an annualized return of only +5.9% during major hiking cycles versus +11.5% during major easing cycles.
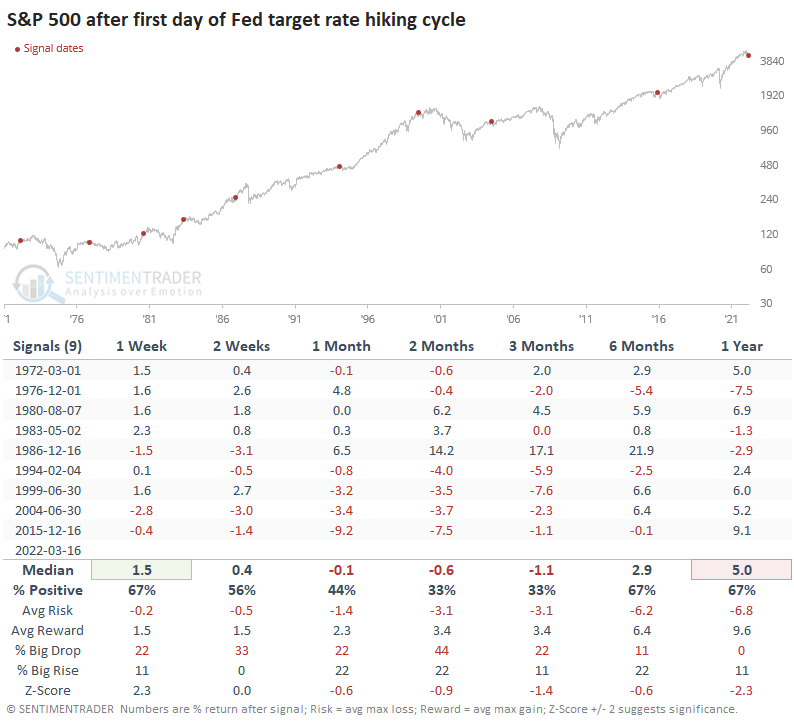
Returns starting the first day of a new hiking cycle were conspicuously weak, with a positive return over the next 2-3 months only a third of the time. The beginning of the last four cycles preceded weak returns up to 3 months later.
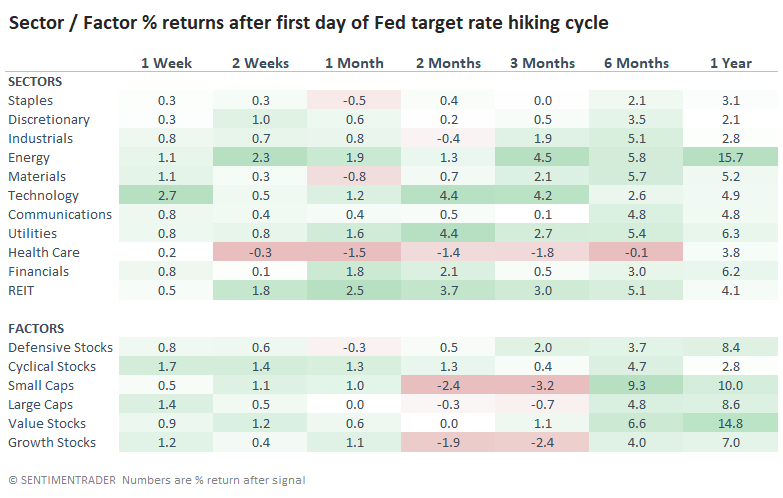
The first day of a major hiking cycle showed stark differences in returns among sectors and factors. Energy shares did exceedingly well, as did Value stocks. However, it was not a clear-cut win for defensive sectors, with Health Care showing curiously poor returns.
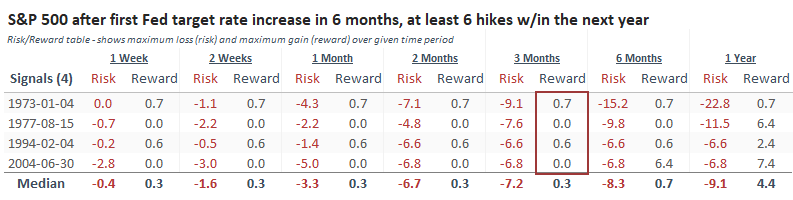
The Fed has penciled in at least 6 rate increases over the next year. After the few times when they had paused or lowered rates for at least 6 months, then started raising them and did so at least 6 more times over the next year, the S&P did not do well.
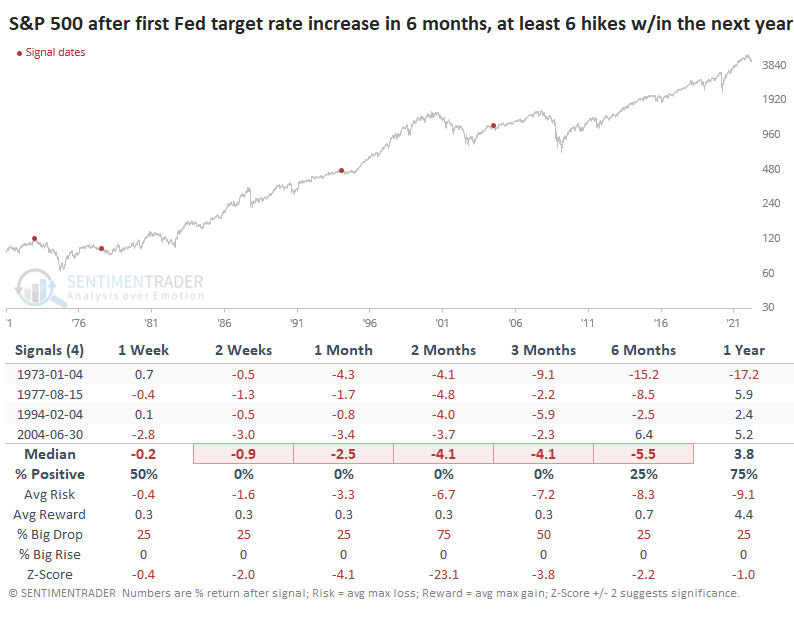
The Risk/Reward Table after these signals was atrocious. The S&P managed to gain more than 0.7% at no point during the next 3 months while suffering a drawdown of at least -6.5% every time. Granted, the sample size is tiny, and if the S&P rallies more than 0.7% at any point from here on out, it would call these historical precedents into question.
Despite headwinds, investors were buying stocks
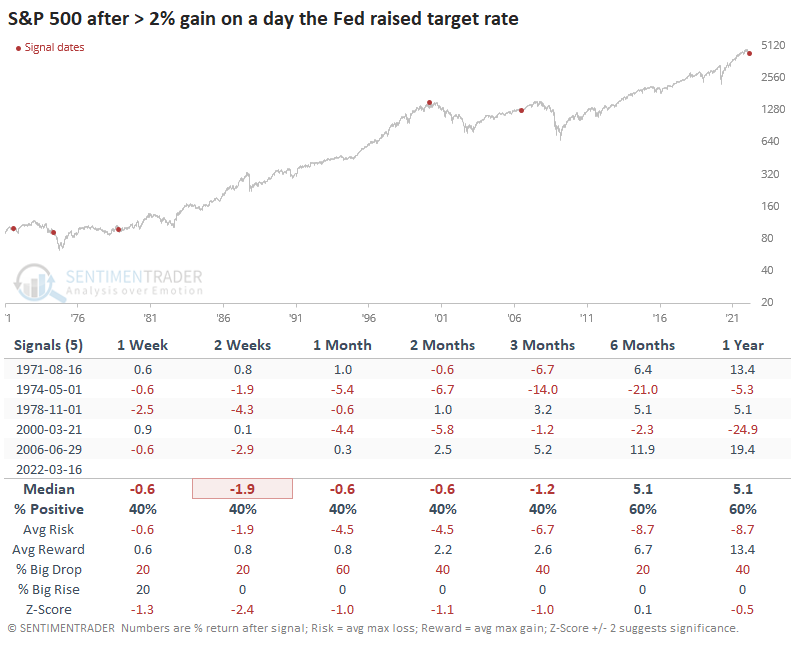
If we look at market returns on any day the Fed raised its target rate, yesterday's session stands out as one of the largest-ever positive reactions. There had been only 5 other days when the S&P 500 rose 2% or more. After the others, it had difficulty holding the momentum, with a negative return at some point between 2-8 weeks later every time.
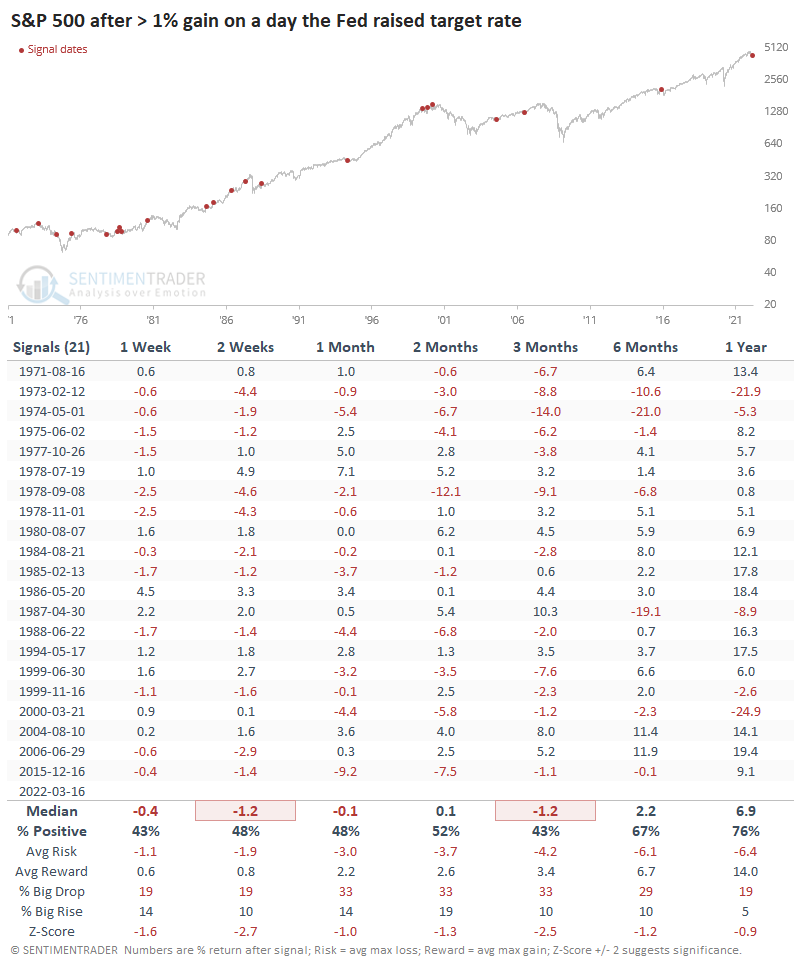
If we expand the sample size by looking for 1% or greater rallies on a day the Fed hiked rates, forward returns were still poor.
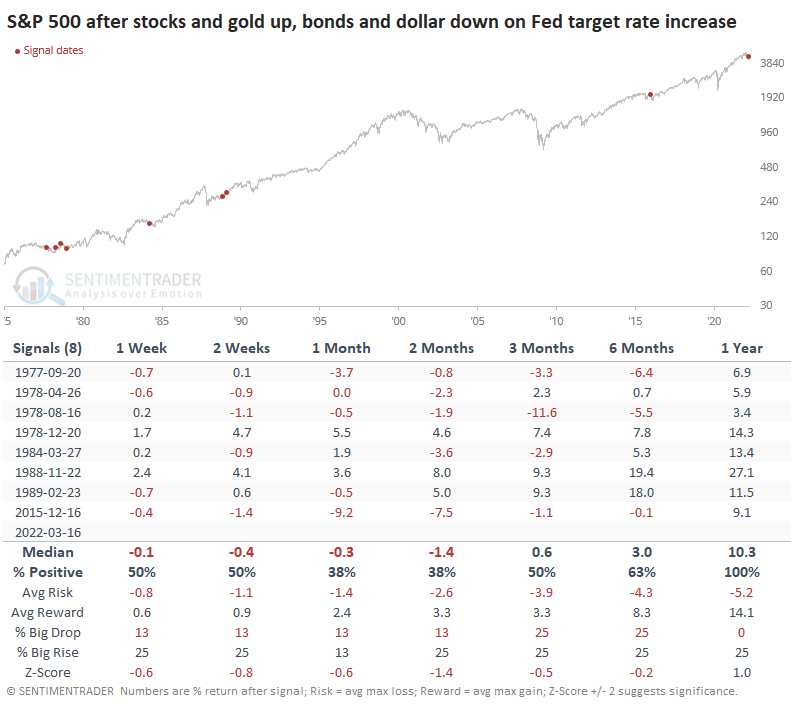
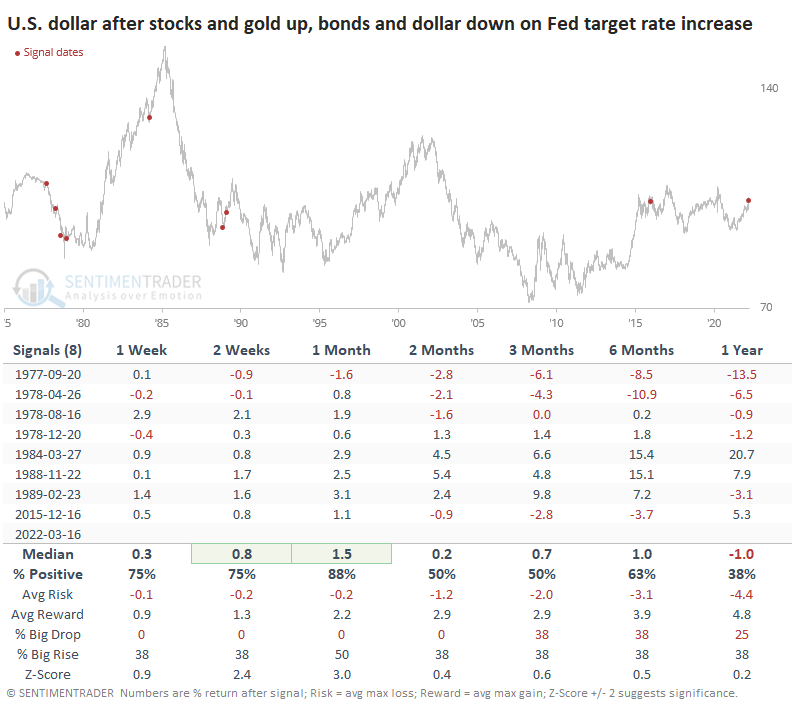
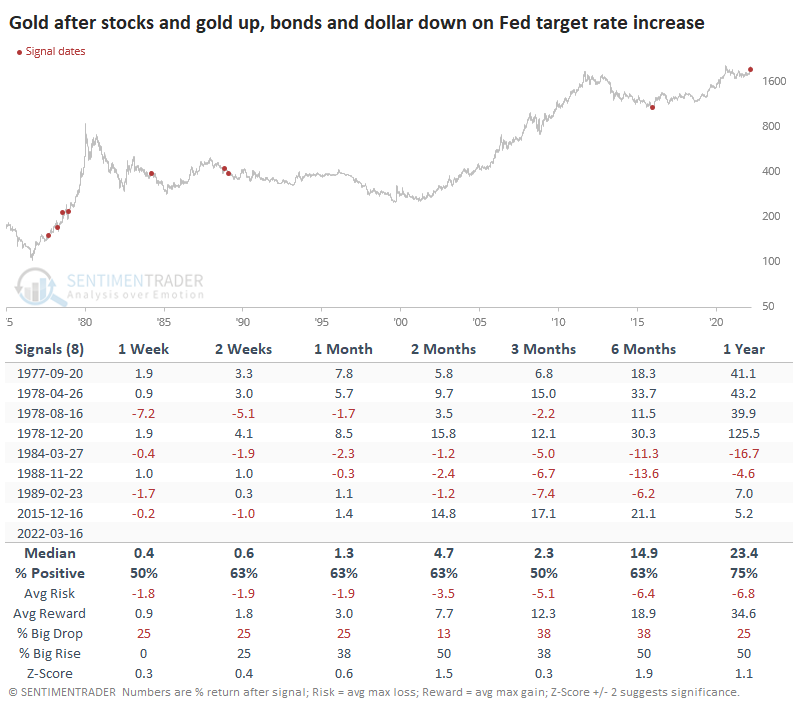
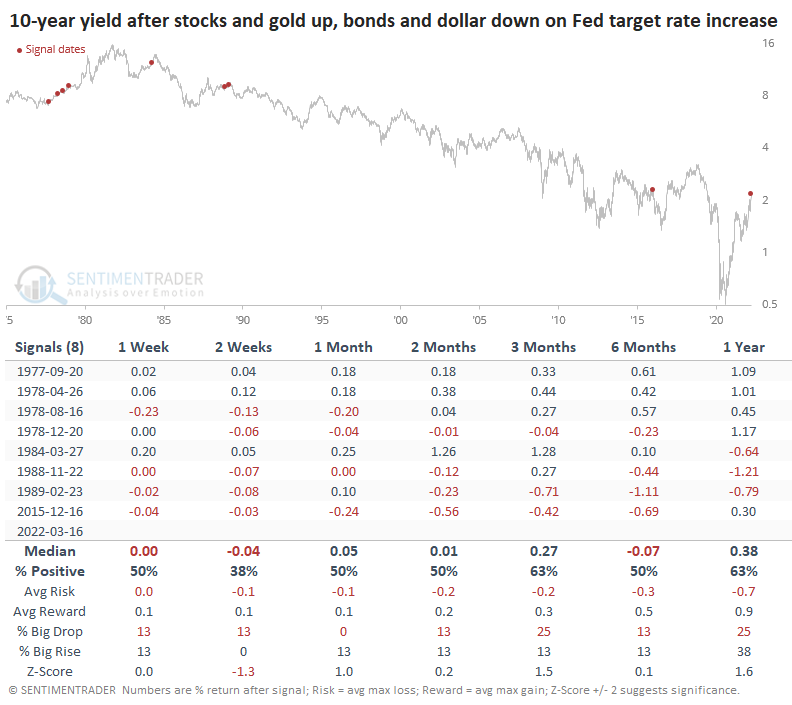
On Wednesday, investors bid up stocks and gold while selling bonds and the dollar. Again, similar behavior preceded mostly weak returns, but the S&P rose all 8 times over the next year.
The dollar tended to rebound in the short term.
Gold did okay, but returns were mixed with no apparent consistency among the dates.
The yield on 10-year Treasuries tended to drop over the short-term, then showed mixed performance.
What the research tells us...
We're always dealing with mixed signals. Very rarely do virtually all elements of an outlook line up and point the same direction, and even when they do, nothing is guaranteed. In recent weeks, there has been a spike in pessimistic sentiment, and even during unhealthy market environments, that has an excellent record of preceding multi-week to multi-month rebounds. There is little question that Federal Reserve policy is turning to what investors have historically considered a headwind, and returns have been below average during these times. That doesn't preclude intermittent rebounds.