Data &
Technology
Research
Reports
Report Solutions
Reports Library
Actionable
Strategies
Free
Resources
Simple Backtest Calculator
Simple Seasonality Calculator
The Kelly Criterion Calculator
Sentiment Geo Map
Public Research Reports
Free Webinar
Pricing
Company
About
Meet Our Team
In the News
Testimonials
Client Success Stories
Contact
Log inLoginSign up
< BACK TO ALL REPORTS

The Nasdaq's run, and potential end

Jason Goepfert
2020-09-03
The Nasdaq Composite has managed to put together a rare run of momentum over the past 1, 3, and 6 months. Its triple-time-frame gains have only two precedents. When both of those finally fell to a new 10-day low, the momentum bubble had been pricked.

The Nasdaq's run over the past 6 months has been well-documented. Leading up to Thursday's drop, it was building even more, with more than a third of stocks in the Nasdaq 100 in overbought territory as Troy pointed out.

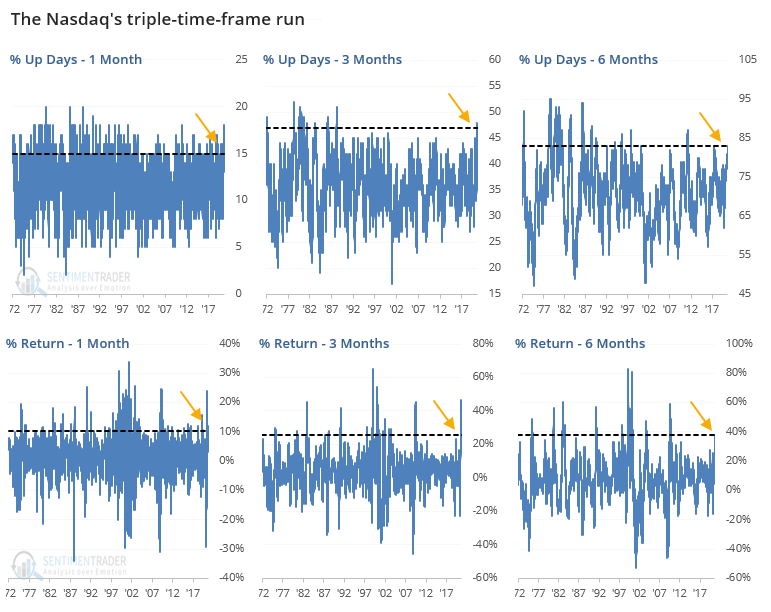
The risk of trying to compare the current one to others is cherry-picking. Analogs can sometimes be useful but have their own pitfalls. Another way we've looked at price momentum is by using a triple time frame, such as performance over 1, 3, and 6 months. We've done this with other assets like the dollar and bonds over the years, but extremes don't trigger very often, especially in stocks.

The Nasdaq has become an exception. If we look at those time frames, then leading up to yesterday the Composite was showing among the most consistent and large gains in its nearly 50-year history.

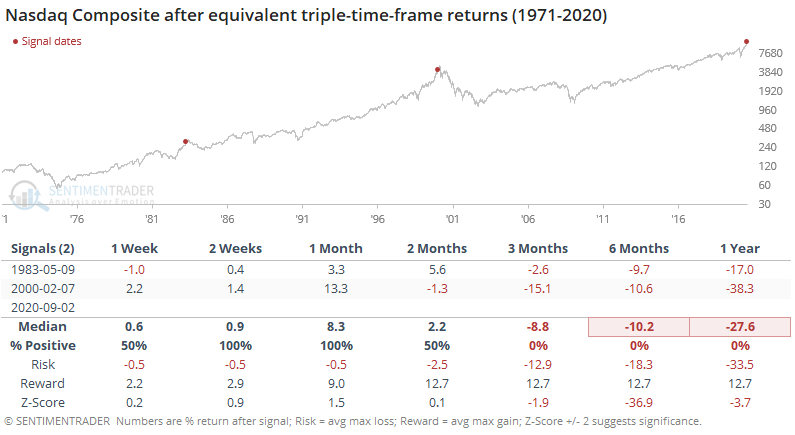
Since its 1971 inception, there have been 2 other time periods that match its current run.

  • 1-month gain of >= 10% with >= 15 positive days
  • 3-month gain of >= 20% with >= 45 positive days
  • 6-month gain of >= 30% with >= 80 positive days

Below, we can see that neither one marked an exact peak for the Nasdaq, as it ran higher over the next month both times. Then...not.

Because of the momentum, short-sellers got run over for weeks at a time even after the rally had reached fever pitch. Waiting for some kind of weakness allowed one to avoid that but defining "some kind of weakness" leaves it open to subjective judgment. Waiting for a close below the 20-day average worked okay.

Old-school trend-followers often used a simple rule like the market reaching a new 10- or 20-day low. The former worked well. Once the Nasdaq had reached a fever pitch like this in May 1983 and February 2000, it continued to run until it broke below its prior 10-day minimum price.

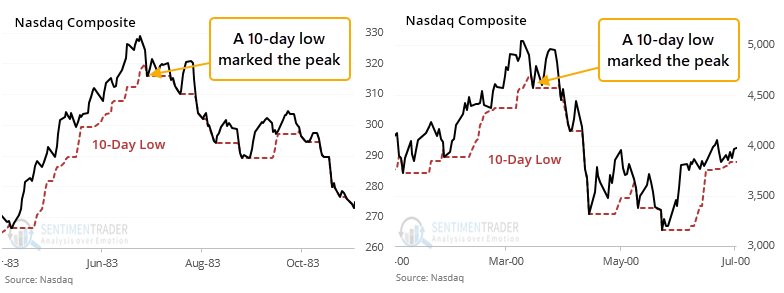
Currently, that's at 11,311, not far from where it's trading Thursday afternoon. There is nothing magical about this at all, it's just an old rule of thumb, and it worked the two other times there was runaway behavior like this. 

So far during the massive rally since March, tech stocks suffered big one-day declines or reversals on June 11, June 24, and July 13. Each time, it rebounded the next day and saw only limited weakness in the week ahead. With so many factors lining up lately for a return to mean-reversion, an inability for the Nasdaq to snap back right away, setting a fresh 10-day low in the process, would be a good clue that reversion has begun.

Sorry, you don't have access to this report

Upgrade your subscription plan to get access
Go to Dasboard
DATA &
TECHnologies
IndicatorEdge
‍
BackTestEdge
‍
Other Tools
‍
DataEdge API
RESEARCH
reports
Research Solution
‍
Reports Library
‍
actionable
Strategies
Trading Strategies
‍
Smart Stock Scanner
‍
FREE
RESOUrCES
Simple Backtest
Calculator
Simple Seasonality
Calculator
The Kelly Criterion
Calculator
Sentiment Geo Map
‍
Public Research Reports
‍
Free Webinar
COMPANY
‍
About
‍
Meet our Team
‍
In the News
‍
Testimonials
‍
Client Success Stories
Pricing
Bundle pricing
‍
Announcements
‍
FAQ
© 2024 Sundial Capital Research Inc. All rights reserved.
Setsail Marketing
TermsPrivacyAffiliate Program
Risk Disclosure: Futures and forex trading contains substantial risk and is not for every investor. An investor could potentially lose all or more than the initial investment. Risk capital is money that can be lost without jeopardizing ones’ financial security or life style. Only risk capital should be used for trading and only those with sufficient risk capital should consider trading. Past performance is not necessarily indicative of future results.

Hypothetical Performance Disclosure: Hypothetical performance results have many inherent limitations, some of which are described below. No representation is being made that any account will or is likely to achieve profits or losses similar to those shown; in fact, there are frequently sharp differences between hypothetical performance results and the actual results subsequently achieved by any particular trading program. One of the limitations of hypothetical performance results is that they are generally prepared with the benefit of hindsight. In addition, hypothetical trading does not involve financial risk, and no hypothetical trading record can completely account for the impact of financial risk of actual trading. for example, the ability to withstand losses or to adhere to a particular trading program in spite of trading losses are material points which can also adversely affect actual trading results. There are numerous other factors related to the markets in general or to the implementation of any specific trading program which cannot be fully accounted for in the preparation of hypothetical performance results and all which can adversely affect trading results.

Testimonial Disclosure: Testimonials appearing on this website may not be representative of other clients or customers and is not a guarantee of future performance or success.