
The Nasdaq's crash pattern is eerily similar to others since 1971

Why the Nasdaq is (almost) like 1998
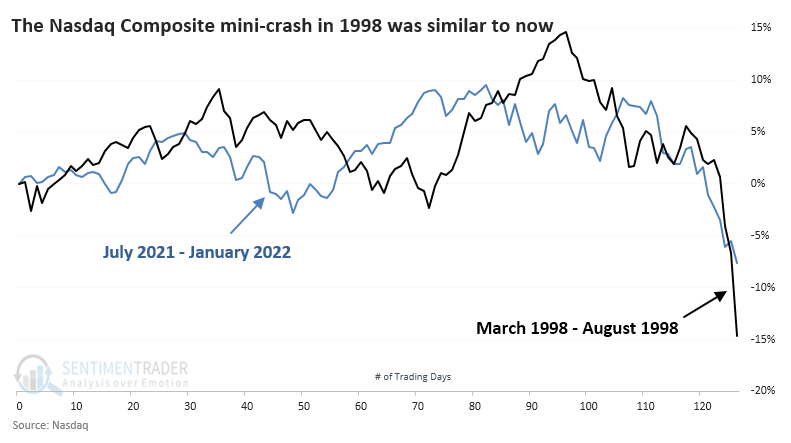
Trading activity over the past week has the feel of 1998 when stocks suffered a mini-crash. The Russian connection from then (they devalued the ruble) and now is coincidental. It's more that the price moves have a similar feel. I distinctly remember the panic our margin clerks felt when unable to reach clients who were under their equity requirements, and it's not hard to imagine similar feelings happening this week.
The charts are relatively similar, at least in that the Nasdaq went up, then down quickly.
We've learned over and over again over the years that memories and eyeballs can be deceiving. Just because the price action feels similar doesn't mean it necessarily was.
When we use our objective analog calculations to search for the highest-correlated periods since the Composite's inception in 1971, the year 1998 doesn't show up on the radar. It was close but didn't make the cut of highest-correlated 6-month analogs.
When we take a look at the closest 6- and 12-month price patterns since 1971, some compelling comparisons emerge.

| Stat box So few stocks in the Nasdaq 100 are trading below their 10-day moving averages that it ranks in the bottom 40 of all days in the past 15 years. After the other signals, the index was higher a year later each time, averaging 30.3%. |
An extended period of individual investor pessimism
The AAII sentiment survey can be used as a contrary indicator to identify an environment where sentiment has become too pessimistic on the future direction of stocks. When opinions become too bearish, stocks tend to rally.
The bull-bear spread trading model identifies when bears have been greater than bulls for 8 out of 10 weeks. The lookback count indicator must reset below 2 weeks for a new signal to trigger, and I do not use an index momentum condition with this signal.
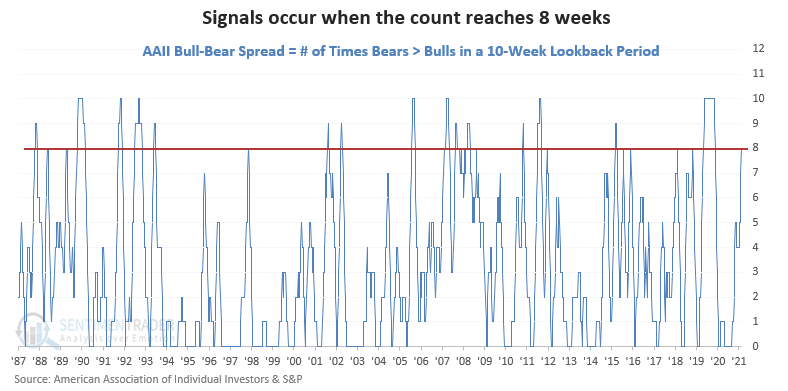
This signal has triggered 17 other times over the past 34 years. After the others, S&P 500 future returns and win rates were solid across almost all time frames, especially the 3-month window. A year later, stocks were higher 94% of the time.
