Products
SentimenTrader Trading Tools
‍
Backtest Engine
My Trading Toolkit
Correlation Analysis
Seasonality
Market Prediction
Indicators & Data API
‍
Proprietary Indicators & Charts
Market Data API
Strategies & Scanner
‍
50+ Trading Strategies
Smart Stock Scanner
Smart Option Scanner
Research Reports
‍
Research Solutions
Reports Library
Free Resources
Simple Backtest Calculator
Simple Seasonality Calculator
The Kelly Criterion Calculator
Sentiment Geo Map
Public Research Reports
Education
Sentiment Indicators
Technical Indicators
Pricing
Company
About
In the News
Testimonials
Client Success Stories
Contact
Log inLoginSign up
< BACK TO ALL REPORTS

The Nasdaq triggers a rare breadth signal

Dean Christians
2023-11-16
The Nasdaq generated a bullish signal this week when advancing issues outpaced declining issues by a meaningful amount in three out of ten sessions. Similar breadth-based signals produced extremely bullish outcomes for the Nasdaq Composite and the S&P 500.

Key points:

  • Nasdaq advancing issues outpaced declining issues by a 3-to-1 ratio in three out of ten sessions
  • Similar advance-decline ratio skews led to outstanding returns for the Nasdaq Composite
  • When Nasdaq breadth leans bullish like now, S&P 500 returns and win rates are robust

A rare and bullish market breadth signal

Over the past few weeks, the research team has shared numerous breadth-based buy signals suggesting a new upswing in the cyclical advance after the 10% correction. When examining market breadth, I like to see a broad spectrum of indexes and exchanges generate alerts as the likelihood of encountering a whipsaw scenario decreases with widespread participation. 

With New York Stock Exchange data triggering a Zweig Breadth Thrust and over 25% of stocks closing with a daily gain of 4% or more, a signal from the Nasdaq Exchange would provide a compelling case for a continuation of the rally.

As luck would have it, the Nasdaq generated a bullish signal this week when advancing issues outpaced declining issues by a 3-to-1 ratio in three out of ten sessions. 

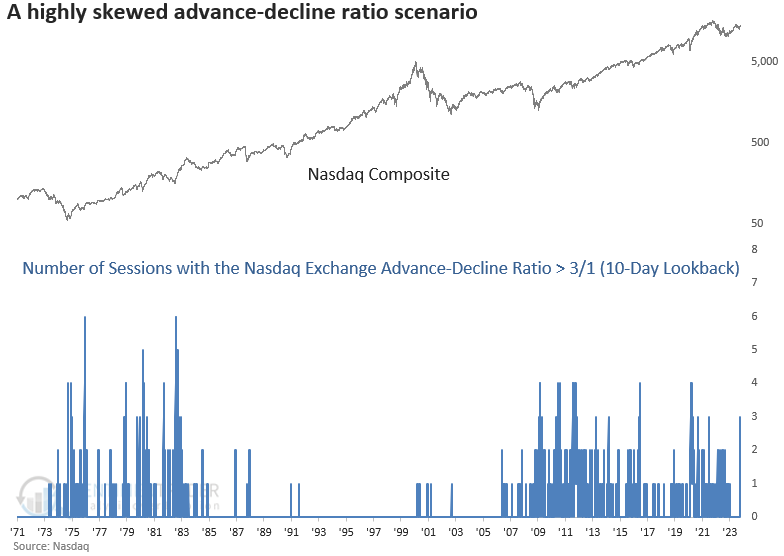
Similar advance-decline ratio conditions preceded excellent returns

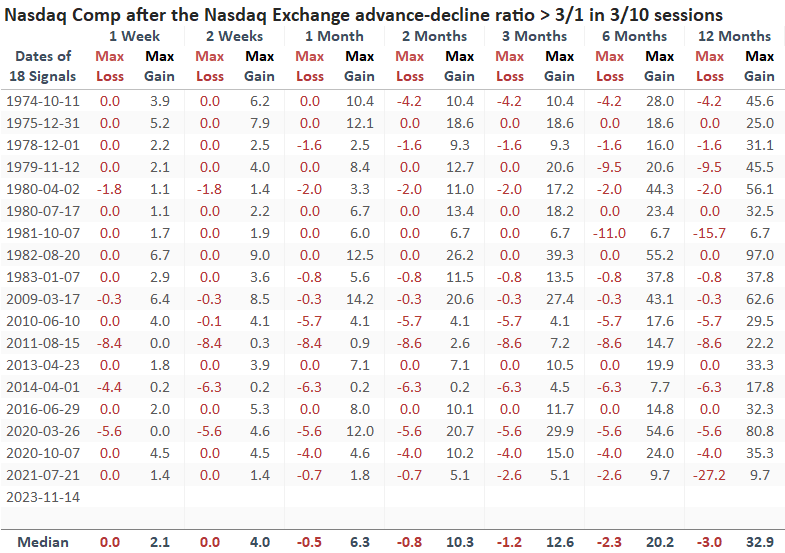
Whenever Nasdaq Exchange advancing issues outpaced declining issues by a 3-to-1 ratio in three out of ten sessions, returns, win rates, and z-scores for the Nasdaq Composite are outstanding. Over the subsequent three months, the composite rallied 100% of the time. 

If I were to speculate on the prolonged gap between signals from 1982 to 2009, my hunch leans towards alterations in market structure as the main culprit.  

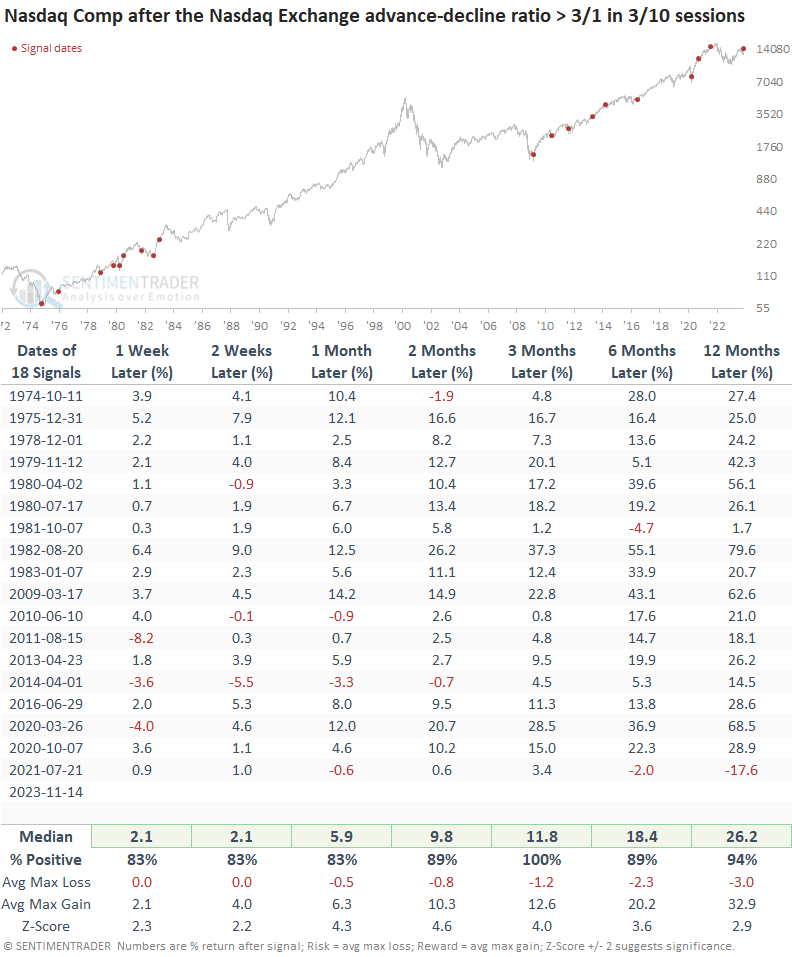
Over the subsequent two months, the max gain exceeded the max loss in 15 of 18 cases. Additionally, the Nasdaq Composite encountered only four precedents of losses surpassing 5% over that same period.

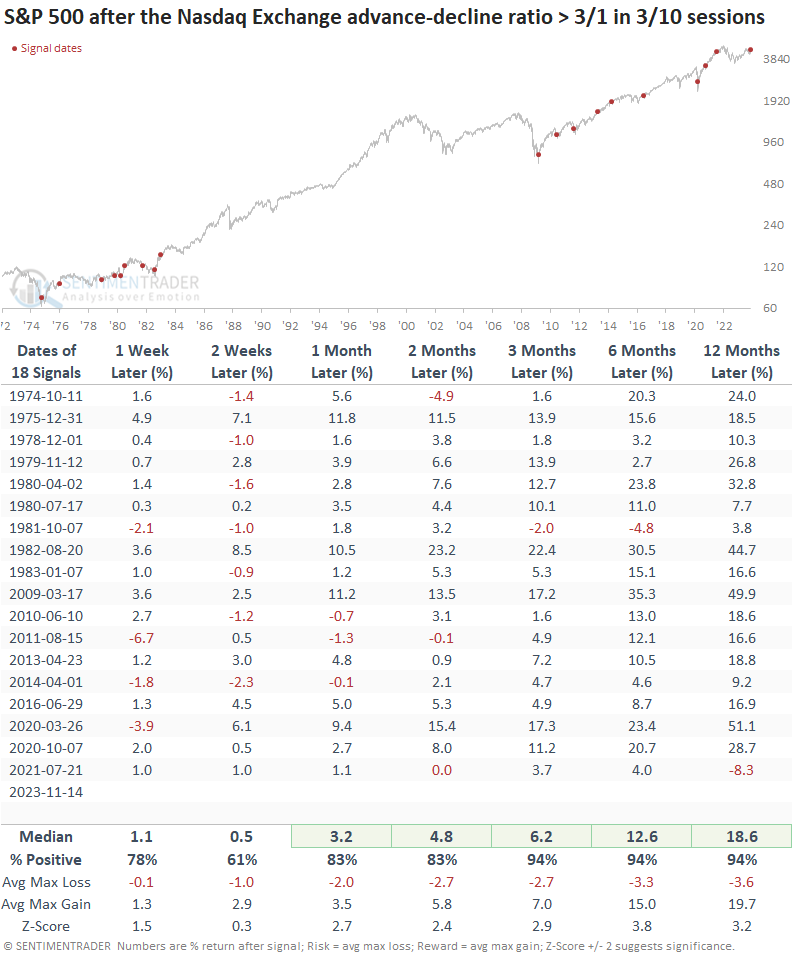
Bullish for the broad market

As one might expect, when advancing issues outnumber declining issues on the Nasdaq Exchange like now, the S&P 500 performs exceptionally well.

What the research tells us...

Advancing issues outpaced declining issues by a 3-to-1 ratio in three out of ten sessions on the Nasdaq Exchange. After similar signals, the Nasdaq Composite and the S&P 500 displayed excellent results across all time horizons. With markets rallying significantly over the last three weeks, a pause that refreshes a new upswing would not be surprising.

PRODUCTS
SentimenTrader
Trading Tools
Indicators & Data API
‍
Strategies & Scanner
‍
Research Reports
FREE
RESOUrCES
Simple Backtest
Calculator
Simple Seasonality
Calculator
The Kelly Criterion
Calculator
Sentiment Geo Map
‍
Public Research Reports
‍
Education
Sentiment Indicators
‍
Technical Indicators
‍
Pricing
Bundle pricing
‍
FAQ
‍
Announcements
‍
COMPANY
‍
About
‍
In the News
‍
Testimonials
‍
Client Success Stories
CONTACT
‍
General Inquiries
‍
Media Inquiries
‍
Financial Professionals Inquiries
‍
© 2026 Sundial Capital Research Inc. All rights reserved.
Setsail Marketing
TermsPrivacyAffiliate Program
Risk Disclosure: The information and tools provided are for research and analytical purposes only and are not intended as investment advice. Market analysis involves uncertainty, and outcomes may differ from expectations. Users should conduct their own due diligence and consider their individual circumstances before making any financial decisions. Past performance is not necessarily indicative of future results.

Hypothetical Performance Disclosure: Hypothetical performance results have many inherent limitations, some of which are described below. No representation is being made that any account will or is likely to achieve profits or losses similar to those shown; in fact, there are frequently sharp differences between hypothetical performance results and the actual results subsequently achieved by any particular trading program. One of the limitations of hypothetical performance results is that they are generally prepared with the benefit of hindsight. In addition, hypothetical trading does not involve financial risk, and no hypothetical trading record can completely account for the impact of financial risk of actual trading. for example, the ability to withstand losses or to adhere to a particular trading program in spite of trading losses are material points which can also adversely affect actual trading results. There are numerous other factors related to the markets in general or to the implementation of any specific trading program which cannot be fully accounted for in the preparation of hypothetical performance results and all which can adversely affect trading results.

Testimonial Disclosure: Testimonials appearing on this website may not be representative of other clients or customers and is not a guarantee of future performance or success.