
The Nasdaq suffers a cluster of technical sell signals

Key points:
- The Hindenburg Omen and Titanic Syndrome technical sell signals have triggered on the Nasdaq
- Days that meet the conditions of the signals tend to show below-average returns in the months ahead
- Small clusters of signals only on the Nasdaq haven't been a consistent and imminent worry, however
Technical conditions are deteriorating on the Nasdaq exchange
Some technical sell signals have been triggered for the first time since stocks peaked a year and a half ago. We last discussed these in November 2021, and it's been a tough slog ever since.
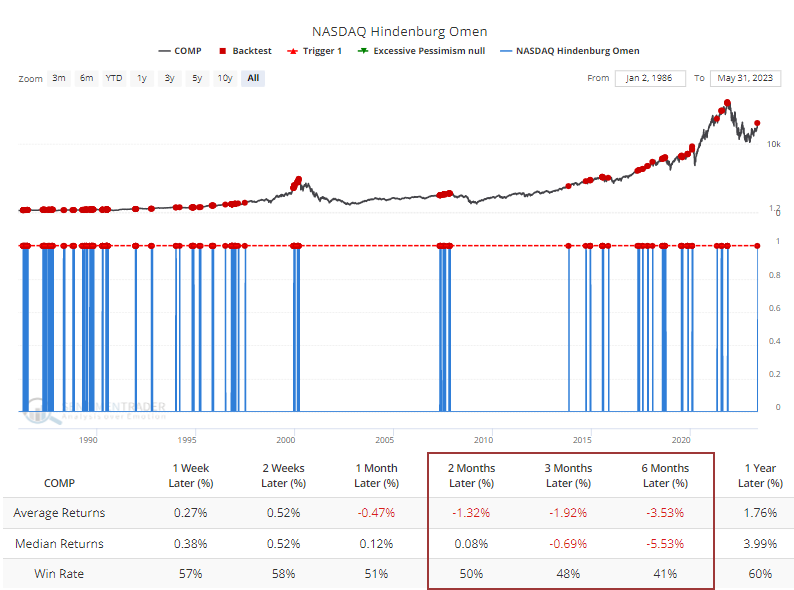
Specifically, we're referring to the Hindenburg Omen. Over the past couple of decades, we've seen the value in paying attention to clusters of these signals, even if others ignore them simply because of hyperbolic naming.
The Hindenburg Omen is a technical warning sign that was created by James Miekka in the 1990s, based on work from Norman Fosback in the 1970s. It monitors conditions that analysts have looked at throughout history as signifying potential weakness underlying the market. For this particular signal, we use three criteria, which likely differ from other sources: 1) The Nasdaq 100 is above its 50-day moving average, 2) Both new 52-week lows and 52-week highs on the Nasdaq are greater than 2.8% of all advancing and declining issues, and 3) The Nasdaq McClellan Oscillator is negative. When the signal triggers, it highlights a "split" market, which is unhealthy. Multiple signals in a cluster is a worrying sign. Traditionally, the signal is canceled after 30 days or if the Oscillator turns positive again, though we've seen that it can lead to market trouble several months in advance.
The signals have been triggered only on the Nasdaq exchange so far. Data for the NYSE haven't met the requirements for the signal. Even so, the Backtest Engine shows that when the Nasdaq triggered an Omen, returns for the Composite going forward weren't especially pleasant. Over the next six months, the Composite rallied only 41% of the time, averaging a return of a miserly -5.5%.
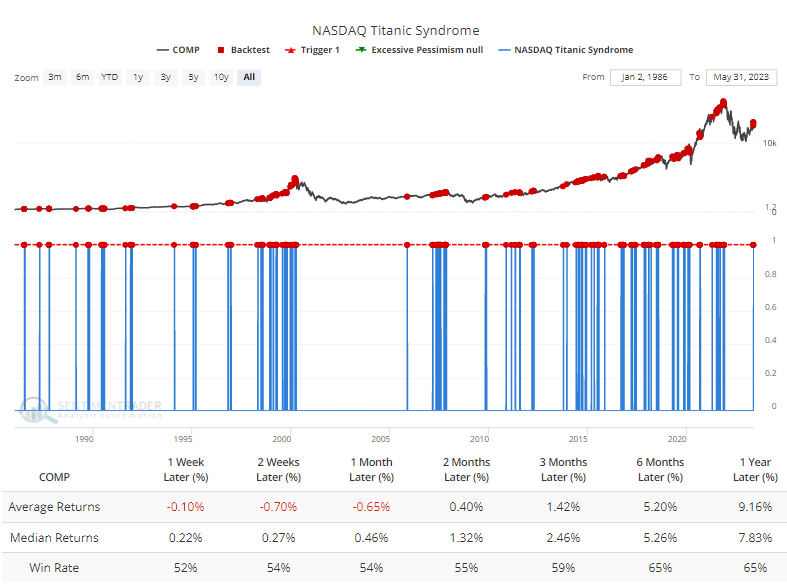
While lesser known, the Titanic Syndrome for the Nasdaq exchange has also been triggered on a handful of days over the past week or so.
The Titanic Syndrome was created by Bill Omaha in the 1960s. It highlights a technical market condition when stocks have recently been at a high, and then there is a sudden jump in new 52-week lows versus highs on the Nasdaq For our purposes, we use the following conditions: 1) The Nasdaq 100 closed at a 52-week high at some point in the past 7 sessions, and 2) New 52-week lows outnumber 52-week highs on the Nasdaq. It is a warning sign that typically precedes trouble over the next 1-3 months.
The Backtest Engine shows that forward returns for the Composite weren't terrible after a single Titanic signal.
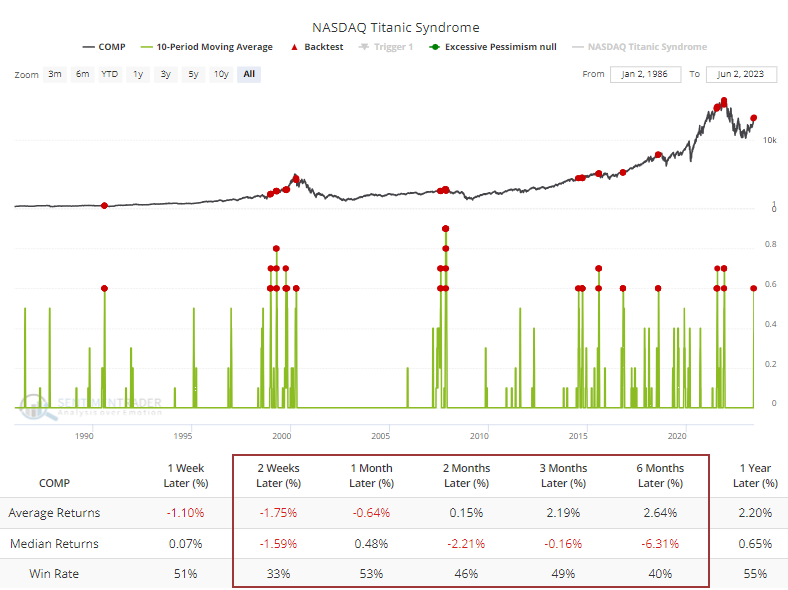
As previously discussed, however, clusters of days with these conditions have been the most reliable warning. The Backtest Engine shows that when at least half of the sessions over a 10-day period suffered from this technical condition, forward returns in the Composite were poor.
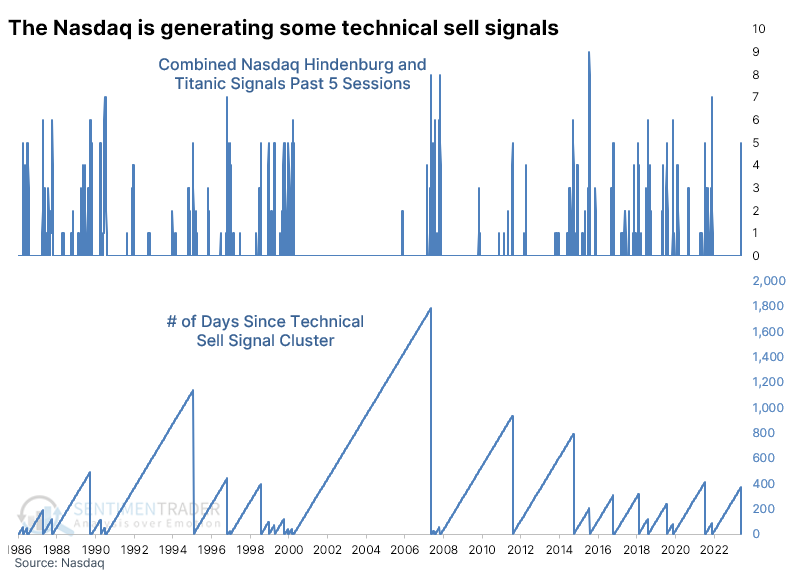
The chart below shows the number of combined Hindenburg and Titanic signals for the Nasdaq over five days. We just reached five signals, the first time in nearly 400 sessions that these conditions have been present to this degree.
Small clusters of sell signals weren't an immediate worry
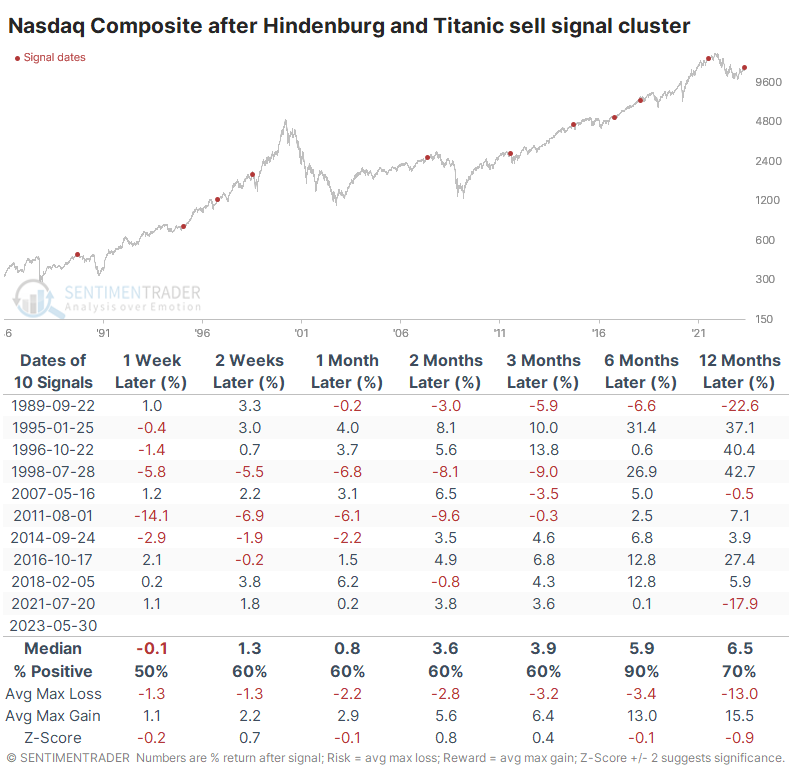
The table below shows forward returns in the Nasdaq Composite after a cluster of at least five combined technical sell signals over the past five sessions. And the results were...not too bad.
When these conditions were first triggered, the Composite tended to keep rising. Most of the time, though, the pressure was building, and much of those gains were reversed over longer time frames. Still, the Composite showed a positive return over the next six months after 9 of the 10 signals, so it didn't exactly serve as an imminent warning.
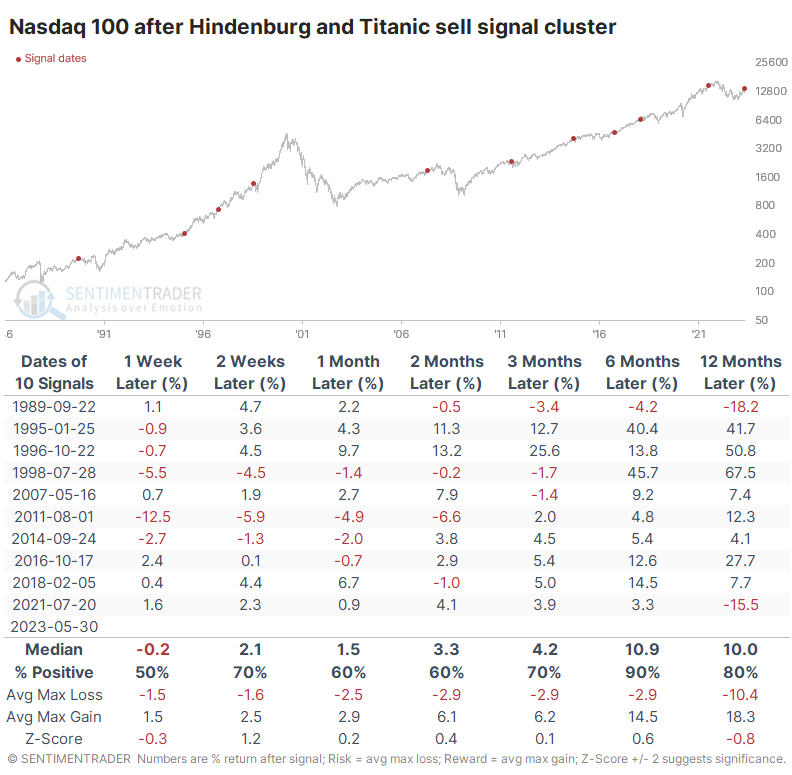
For the Nasdaq 100, it was even less of a warning. This index of big-cap Technology stocks performed quite well in the months ahead, again with a gain 9 out of 10 times six months later, averaging double-digits.
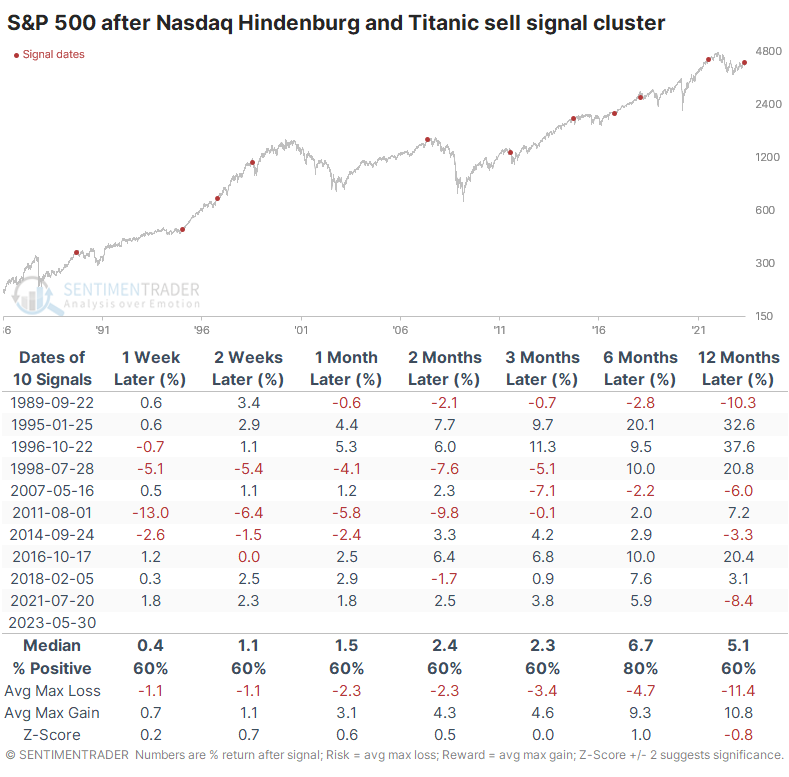
For the broader market, reflected in the S&P 500, these technical sell signal clusters also weren't much use as an imminent warning sign. The index showed a gain 8 out of 10 times six months later, and the two losses were minor (but fell into significance longer-term).
What the research tells us...
We pay attention whenever we see the conditions that trigger technical sell signals like the Hindenburg Omen and Titanic Syndrome. Not as an immediate reason to lighten exposure but rather to highlight the type of market environment where further gains are less likely to be sustainable.
So far, the sell signals are confined to the Nasdaq exchange and it's far from the heavy clusters seen in the fall of 2021. Clusters of these signals tend to be more reliable than individual days, and the Hindenburg Omen tends to be more reliable than the Titanic Syndrome. There has only been a single session that triggered an Omen lately, but it bears watching in the days and weeks ahead. The more days that trigger the condition, the more likely the gains will reverse.