Data &
Technology
Research
Reports
Report Solutions
Reports Library
Actionable
Strategies
Free
Resources
Simple Backtest Calculator
Simple Seasonality Calculator
The Kelly Criterion Calculator
Sentiment Geo Map
Public Research Reports
Free Webinar
Pricing
Company
About
Meet Our Team
In the News
Testimonials
Client Success Stories
Contact
Log inLoginSign up
< BACK TO ALL REPORTS

The Nasdaq has run and run and run

Jason Goepfert
2020-09-04
The Nasdaq's run over triple time frames has been matched only twice before in its nearly 50-year history.

The Nasdaq's run over the past 6 months has been well-documented. Leading up to Thursday's drop, it was building even more, with more than a third of stocks in the Nasdaq 100 in overbought territory as Troy pointed out.

The risk of trying to compare the current one to others is cherry-picking. Analogs can sometimes be useful but have their own pitfalls. Another way we've looked at price momentum is by using a triple time frame, such as performance over 1, 3, and 6 months. We've done this with other assets like the dollar and bonds over the years, but extremes don't trigger very often, especially in stocks.

The Nasdaq has become an exception. If we look at those time frames, then leading up to yesterday the Composite was showing among the most consistent run of positive sessions and large gains in its nearly 50-year history.

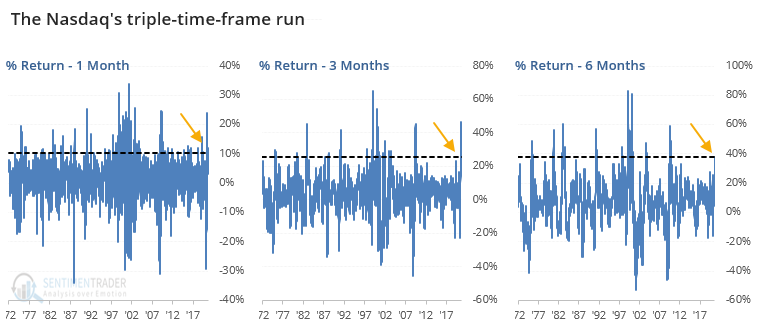
Since its 1971 inception, there have been 2 other time periods that match its current run. The Nasdaq managed to continue higher over the next month both times, but an old-school trend-following exit did a good job of getting an investor out before the index suffered its worst losses.


This is an abridged version of our recent reports and notes. For immediate access with no obligation, sign up for a 30-day free trial now.

We also looked at:

  • A closer look at the Nasdaq's run, and its two historical precedents, along with the exit
  • Over the past two months, our Risk Level has failed, with 2 time periods showing a similar failure to lead to weakness
  • The "dumb" money has been right over past 2 months to a degree that has been matched only a handful of times since we started compiling it in 1998
  • What happens after very sharp selloffs from a high in the S&P 500
  • The Nasdaq's streak above its 20-day average is in jeopardy
  • For the first time in months, more than half of Nasdaq stocks are below their 50-day averages
DATA &
TECHnologies
IndicatorEdge
‍
BackTestEdge
‍
Other Tools
‍
DataEdge API
RESEARCH
reports
Research Solution
‍
Reports Library
‍
actionable
Strategies
Trading Strategies
‍
Smart Stock Scanner
‍
FREE
RESOUrCES
Simple Backtest
Calculator
Simple Seasonality
Calculator
The Kelly Criterion
Calculator
Sentiment Geo Map
‍
Public Research Reports
‍
Free Webinar
COMPANY
‍
About
‍
Meet our Team
‍
In the News
‍
Testimonials
‍
Client Success Stories
Pricing
Bundle pricing
‍
Announcements
‍
FAQ
© 2024 Sundial Capital Research Inc. All rights reserved.
Setsail Marketing
TermsPrivacyAffiliate Program
Risk Disclosure: Futures and forex trading contains substantial risk and is not for every investor. An investor could potentially lose all or more than the initial investment. Risk capital is money that can be lost without jeopardizing ones’ financial security or life style. Only risk capital should be used for trading and only those with sufficient risk capital should consider trading. Past performance is not necessarily indicative of future results.

Hypothetical Performance Disclosure: Hypothetical performance results have many inherent limitations, some of which are described below. No representation is being made that any account will or is likely to achieve profits or losses similar to those shown; in fact, there are frequently sharp differences between hypothetical performance results and the actual results subsequently achieved by any particular trading program. One of the limitations of hypothetical performance results is that they are generally prepared with the benefit of hindsight. In addition, hypothetical trading does not involve financial risk, and no hypothetical trading record can completely account for the impact of financial risk of actual trading. for example, the ability to withstand losses or to adhere to a particular trading program in spite of trading losses are material points which can also adversely affect actual trading results. There are numerous other factors related to the markets in general or to the implementation of any specific trading program which cannot be fully accounted for in the preparation of hypothetical performance results and all which can adversely affect trading results.

Testimonial Disclosure: Testimonials appearing on this website may not be representative of other clients or customers and is not a guarantee of future performance or success.